CST谐振腔体设计分析—CST2013设计实例
Eigenmode Visualization and Q-Factor Calculation
Eigenmode Visualization
The eigenmode results can be accessed by selecting the corresponding item in the navigation tree from the 2D/3D Results Modes folder. The field patterns for each mode will be stored in subfolders named Mode N where N represents the mode number.

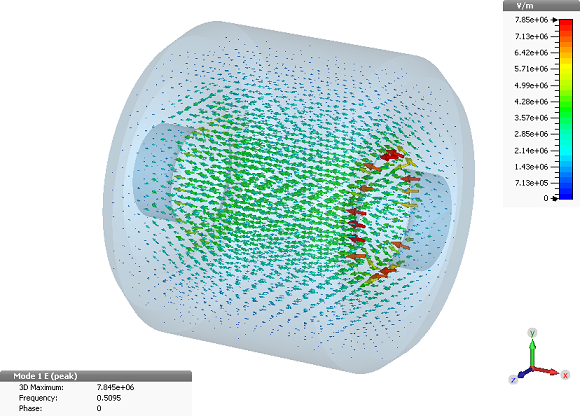
To visualize the electric field of the first mode, select the corresponding item from the navigation bar: 2D/3D Results Modes Mode 1 e. The result data will then be visualized in a three dimensional vector plot as shown in the above picture. (Please note: The field amplitudes of the modes will always be normalized such that each mode contains a total energy of 1 Joule.)
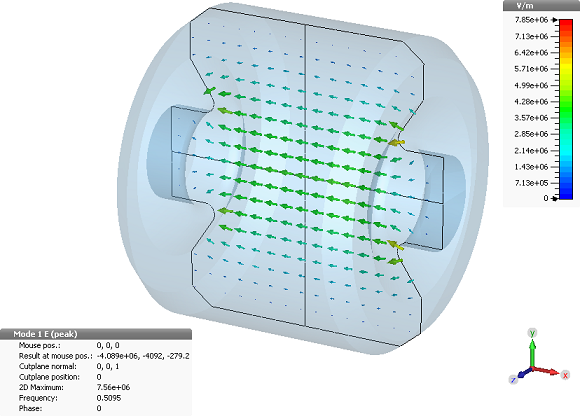
In many cases, it is more important to visualize the fields in a cross section plane. Therefore, please switch to the 2D field visualization mode by pressing 2D/3D Plot: Sectional View 3D Fields on 2D Plane . The field data should then be visualized and appear similar to the picture below. Please refer to the Workflow and Solver Overview manual or press the F1 key for online help to obtain more information on field visualization options.

In addition to the graphical field visualization, some information text containing maximum field strength values and resonance frequencies will also be shown in the main window.
Q Factor Calculation
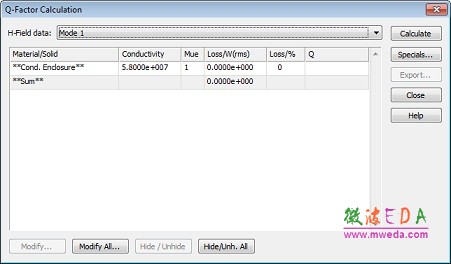
The eigenmodes internal Q-factors, which are an important quantity for cavity design, can be easily derived from the field patterns. Open the loss and Q-factor calculation dialog box by selecting Post Processing: 2D/3D Field Post Processing > Loss and Q .

The only setting that requires specification here is the conductivity of the enclosing metal. By default, the conductivity of the Cond. Enclosure is set to copper (5.8e7 S/m).
You may change this setting by clicking on the first row and selecting the Modify button that opens the following dialog box:

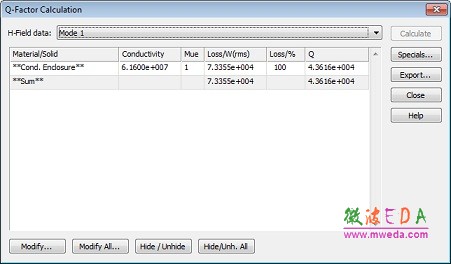
In this example, you can set the Conductivity value to silver (6.16e7 S/m) and press the OK button.
Back in the loss and Q factor calculation dialog box you should now select the desired Mode from the H-Field data list, e.g. the fundamental mode Mode 1. Finally, press the Calculate button to obtain the Q factor value.

The Q-factor is calculated to be 4.36"104 for the fundamental mode.
-

CST中文视频教程,资深专家讲解,视频操作演示,从基础讲起,循序渐进,并结合最新工程案例,帮您快速学习掌握CST的设计应用...【详细介绍】
推荐课程
-
7套中文视频教程,2本教材,样样经典
-
国内最权威、经典的ADS培训教程套装
-
最全面的微波射频仿真设计培训合集
-
首套Ansoft Designer中文培训教材
-
矢网,频谱仪,信号源...,样样精通
-
与业界连接紧密的课程,学以致用...
-
业界大牛Les Besser的培训课程...
-
Allegro,PADS,PCB设计,其实很简单..
-
Hyperlynx,SIwave,助你解决SI问题
-
现场讲授,实时交流,工作学习两不误


