There are several possibilities to visualize particle data within CST PARTICLE STUDIO®.
|
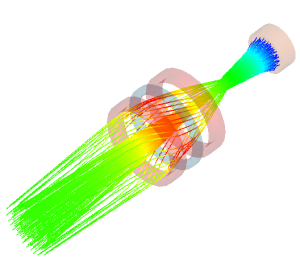
Tracking: Trajectory Plot In a trajectory plot the particles' movement is displayed and colored according to the specific type: If the trajectories of several particle sources were computed, a click on the Trajectory folder displays all trajectories simultaneously. Clicking on a single trajectory plot displays only the flight path of the corresponding particle source. The trajectory plot can be animated and the displayed number of particles and time resolution can be changed. |
|
|
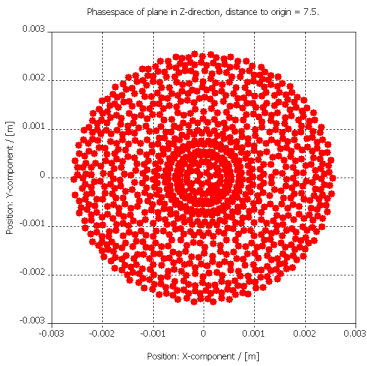
Tracking: Particle Monitor The cross section of a particle beam can be obtained by defining a particle monitor. Such a monitor is defined as a plane which is freely definable in the computational domain or can be defined on an arbitrarily shaped face of a solid or a plane. The particles hitting the plane are monitored and their characteristic data can be displayed in multiple ways. Detailed information about particle monitors plots can be obtained here: particle monitor plots. |
|
|
PIC: Particle Position Plot The particle position plot shows the particle positions at a certain point of time. The plot data is written by the Particle Position Monitor, which is available for the PIC solver. Additionally the particle marker can be colored, in order to visualize specific particle properties:
The particle position plot can be animated and exported to a series of bitmaps. |
|
|
PIC: PIC Phase Space Plot The PIC Phase Space Plot offers the possibility to visualize the kinetic values of all particles versus one coordinate. For each point in time a separate point plot is created. Possible kinetic values are:
Since this plot is a regular 1D plot, all plot properties for these plot types are available: 1D Plot Overview |
|
|
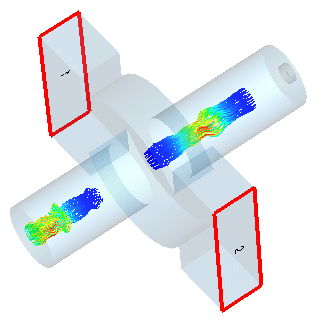
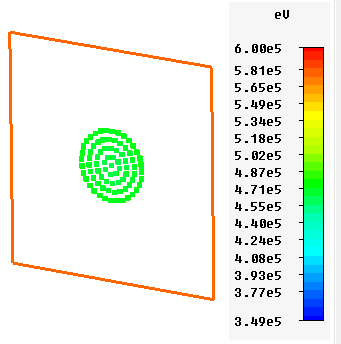
PIC: PIC 2D Monitor Plot This type of monitor offers the possibility to monitor the intersection between a 2D plane and all particles. The particles that intersect within a user defined time span are displayed into one plot frame. There is also a result template to get detailed information about the recorded data. The visualization allows to specify one of the following plot types:
This plot can be animated and exported to a series of bitmaps. The description of all plot properties is explained here: PIC 2D Plot |
|
See also
Post Processing Overview, 1D Plot Overview, Particle Plot, Particle Position Plot, Particle Plot Specials, Particle Monitor Result View, PIC 2D Plot