|
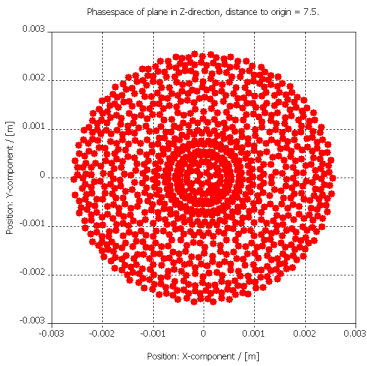
A xy-position plot displays the 2D position of the piercing point of the particles hitting the monitor's surface. The position is presented relative to the monitoring plane's local coordinate system, i.e. monitoring planes defined with the help of a WCS present a WCS related position of the particles position. Monitors defined in the GCS or on an arbitrary surface record the position in absolute coordinates given by the GCS. |
|
|
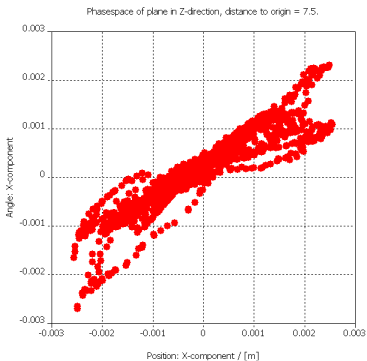
The phasespace plot displays the piercing angle of the particles' velocity to the monitoring plane's normal in respect to the position of the piercing point in one dimension. Choosing the same position direction and angle direction leads to a phasespace-diagram which clearly identifies the focusing or defocusing property of the beam at the monitor's position. |
|
|
The histogram representation displays statistical data of the particles crossing the monitor's surface. The velocity plot displays the normalized quantity of particles with the given velocity. |
|
See also
Dialog Box Particle Monitor, Property Page Position, Property Page General Settings, Property Page Plot Settings