|
微波射频仿真设计 |
|
|
微波射频仿真设计 |
|
| 首页 >> Ansoft Designer >> Ansoft Designer在线帮助文档 |
|
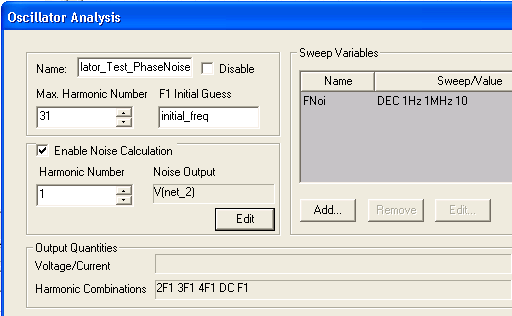
Nexxim Design Examples > Perform a Phase Noise AnalysisThe next exercise is to run phase noise analysis on the oscillator circuit. Nexxim will use the calculated oscillating frequency as the fundamental around which phase noise is computed. 1. Expand the Analysis icon in the Project window and double-click on the Oscillator_Test_PhaseNoise solution setup. The Oscillator Analysis dialog opens.
• The Enable Noise Calculation checkbox is checked. • The default Harmonic Number is 1, the fundamental oscillating frequency. • In the Sweep Variables panel, a sweep of the noise frequency Fnoi has been set up. The sweep is a Decade count, from 1 Hz to 1 MHz using a count of 10. • Click the Edit button under the Noise Output field. The Noise Output dialog opens:
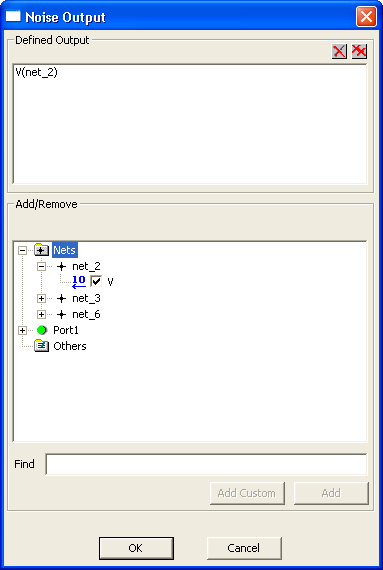
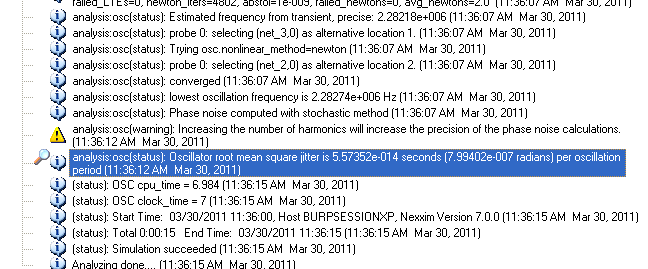
• Expand the Nets icon, and then expand the net_2 icon. The V box under net_2 is selected as the output. The Defined Output panel shows V(net_2). • Click OK to close the Noise Output dialog and return to the Oscillator Analysis dialog. • Click Finish to close the Oscillator Analysis dialog. 2. Expand the Analysis icon in the Project window, right-click the Oscillator_Test_PhaseNoise solution setup, and select Analyze from the menu. The oscillator analysis runs. The Progress window displays a red line to show the progress of the analysis. 3. When the analysis has completed, the Message window reports the oscillator RMS jitter:
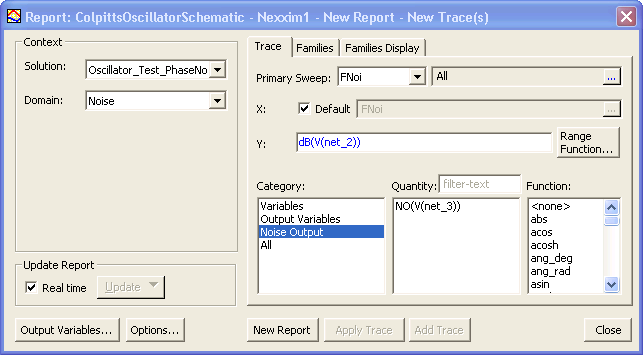
4. Right-click on the Results icon in the Project window and select the PhaseNoise report setup. The Report dialog opens:
• The Solution is Oscillator_Test_PhaseNoise. • Noise is the Domain. • Noise Output is the Category. • The X-axis is the sweep of noise frequency Fnoi. • the Y-axis is the noise output dB(V(net_2)). • Click New Report to generate the report. • Click Close to close the Report dialog. 5. The Report window opens with a graph of the result:
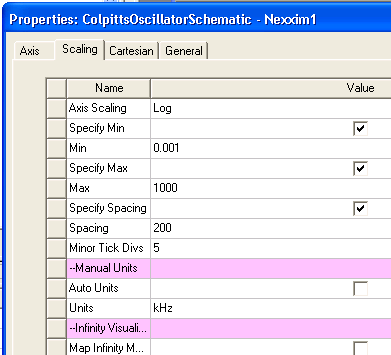
6. The X-axis has been modified to show the double-logarithmic form that is commonly used for displaying phase noise. To see the modifications, Double-click on the X-axis label “Fnoi [MHz]” to open the X-Axis Properties dialog. Select the Scaling tab:
• Axis Scaling is Log scaling (default is Linear). Min is 0.001, Max is 1000, and Minor Tick Divs to 5. The Auto Units option is deselected, and the Units are Khz. • Click OK to close the X-Axis Properties dialog. 7. Close the Project when you are finished viewing the graph. For more information, see Nexxim Oscillator Analysis.
HFSS视频教程 ADS视频教程 CST视频教程 Ansoft Designer 中文教程 |
|
Copyright © 2006 - 2013 微波EDA网, All Rights Reserved 业务联系:mweda@163.com |
|