
轴比频率曲线的问题
来源:edatop
更新时间:2024-07-15
阅读:
好不容易弄出来轴比对频率的曲线,但是发现貌似不太对。
一般情况下,轴比在0°是最小的,所以我想看的曲线是0°的轴比对频率的曲线,但是仿真计算出来的轴比对频率曲线不是很符合各频点监视器的结果。
请问高手这是怎么回事,该怎么设置。
附图:(我还是不会贴出来,就传附件里了)
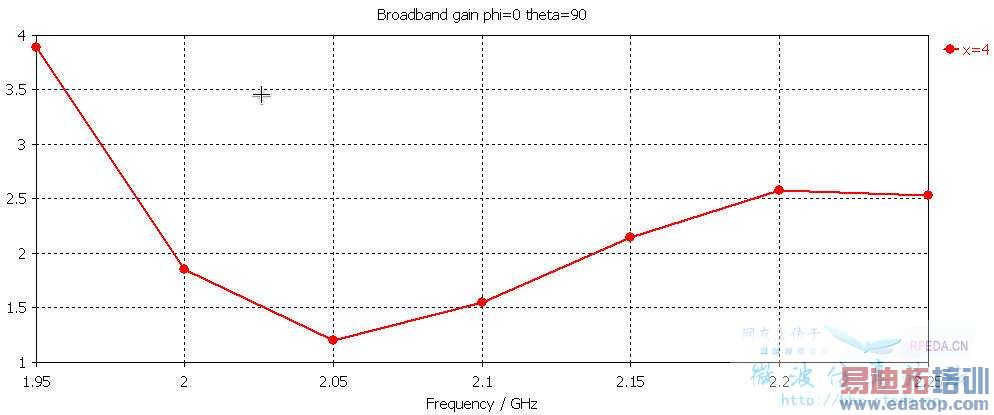
是我得出的轴比频率曲线,但是根据监视器的结果,给个对比
| 频率 | 1.95GHz | 2.00GHz | 2.05GHz | 2.10GHz | 2.15GHz | 2.20GHz | 2.25GHz |
| 轴比频率曲线 | 3.88 | 1.86 | 1.20 | 1.55 | 2.15 | 2.57 | 2.53 |
| 监视器 | 3.20 | 1.98 | 1.27 | 1.23 | 1.86 | 2.67 | 3.36 |
诶图片显示出来了,那怎么把图片穿插在文章里呢。
When you insert the figure, make sure the "[upload=x]" is at the place you want it to be displayed.
It seem they're close, but not exactly the same. So you need to know if this inaccuracy is in the tolerance range or it still need to be improved. Because it's farfield related, you'd better read previous thread which I remembered talking about farfield accuracy improvement.