|
微波射频仿真设计 |
|
|
微波射频仿真设计 |
|
| 首页 >> Ansoft Designer >> Ansoft Designer在线帮助文档 |
|
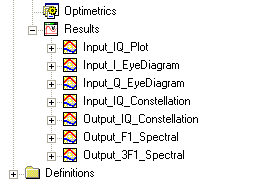
Nexxim Design Examples > View the Results of the AnalysesWhen the analyses have completed, the reports that have been set up become valid. 1. On the Project tree, expand the Results icon:
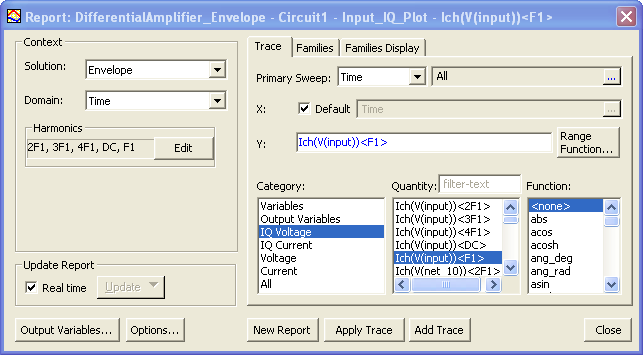
2. Right-click on the Input_IQ_Plot report and select Modify Report to display the setup for the Rectangular Plot report:
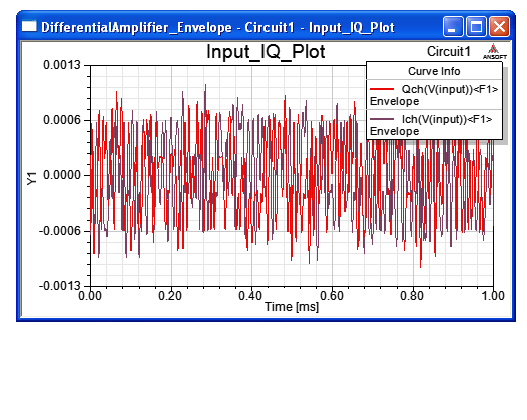
The IQ source drives input node input in our circuit. This dialog shows the setup for the In-quadrature (I) trace. The Q trace has a similar setup. 3. Double left-click on the Input_IQ_Plot report to view the input I-Q data against time:
4. Right-click on the Input_I_EyeDiagram report and select Modify report:
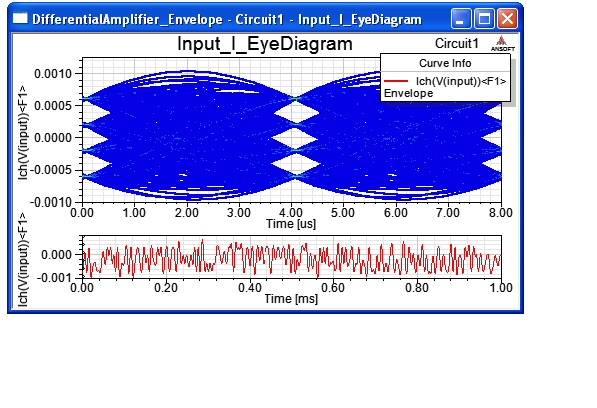
• The Unit Interval is equal to the symbol rate of 4μs. 5. Double left-click on the Input_I_EyeDiagram report to view the I (in-quadrature) data as an eye diagram:
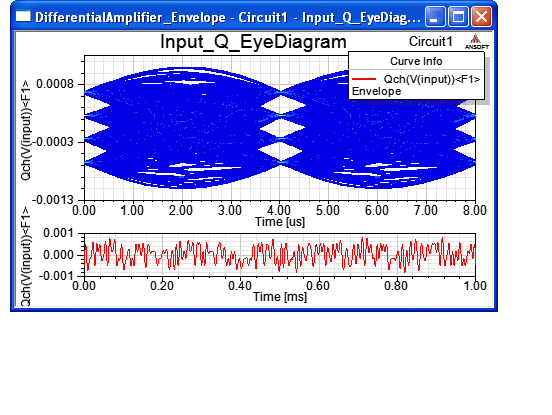
• The diagram shows the levels of amplitude (0.0006V, 0.0002V, -0.0002V,and -0.0006V) in the I-channel. 6. Right-click on the Input_Q_EyeDiagram report to view the Q (quadrature) data as an eye diagram:
• This eye diagram was also created using a Unit Interval of 4μs. • The diagram shows the levels of amplitude in the Q-channel, identical to those for the I-channel (0.0006V, 0.0002V, -0.0002V,and -0.0006V). 7. Right-click the Input IQ Constellation report:
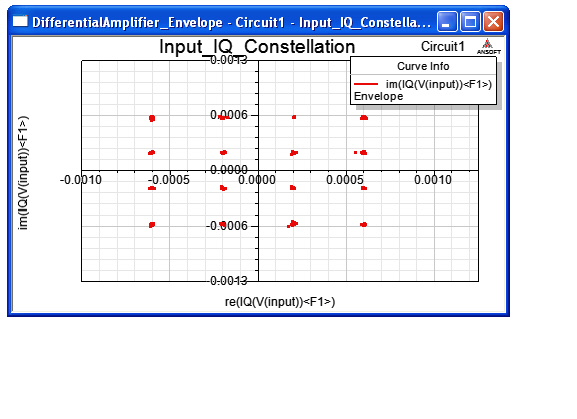
• In the Constellation Parameters section, Constellation has been selected rather than Vector. This choice displays just the constellation points and not the transition vectors. The Sample Period is the same as the unit interval (4μs) 8. Double-click the Input_IQ_Constellation report to view the input IQ data plotted as a constellation chart:
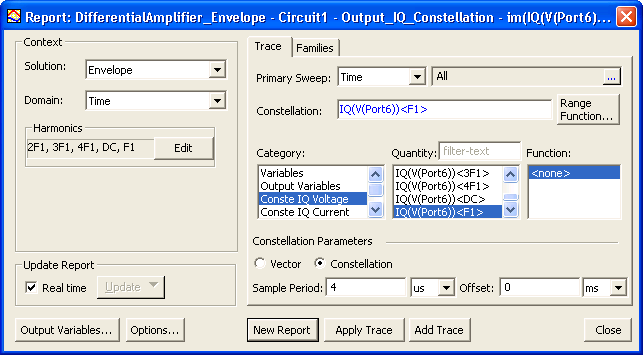
• The constellation diagram shows the clustering of the input I (real) and Q (imaginary) data points. 9. Right-click the Output_Constellation and select Modify Report to open the definition:
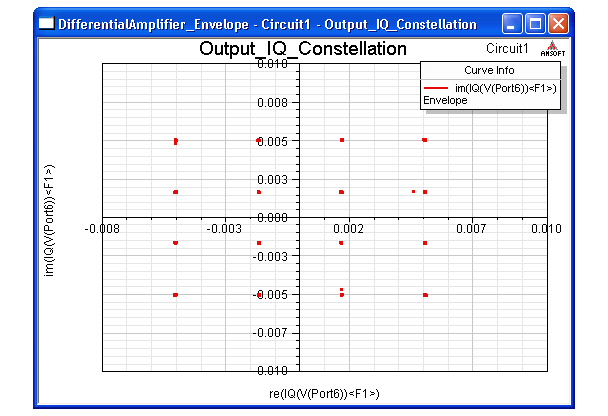
• The output node on our circuit is Port6. The sample period is 4μs as before. 10. Double-click the Output_IQ_Constellation report to view the output data as a constellation chart:
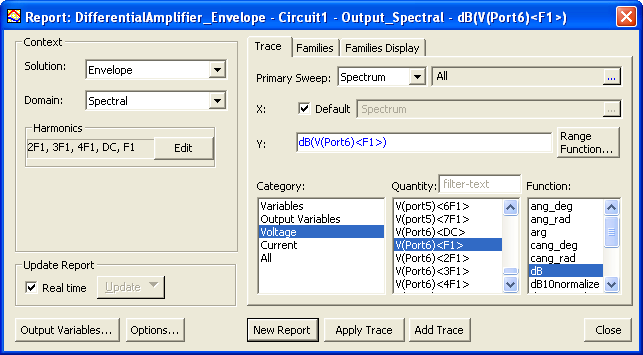
• The chart is not rotated, so no phase distortion is present. 11. Right-click the Output_Spectral report:
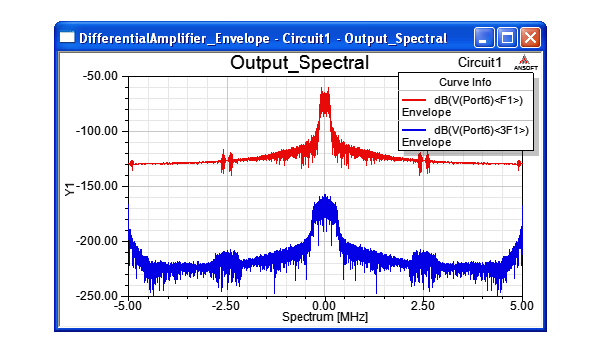
This dialog shows the setup for the F1 spectrum. The F3 setup is essentially the same. 12. Right-click the Output_Spectral report to view the spectral result for the output at the first harmonic (F1) and the third harmonic (F3):
• This complex baseband representation is centered at 0Hz (DC). • The spectrum at 3GHz (3F1) is approximately 100dB lower than the spectrum for the fundamental 1Ghz (F1).
HFSS视频教程 ADS视频教程 CST视频教程 Ansoft Designer 中文教程 |
|
Copyright © 2006 - 2013 微波EDA网, All Rights Reserved 业务联系:mweda@163.com |
|