|
微波射频仿真设计 |
|
|
微波射频仿真设计 |
|
| 首页 >> Ansoft Designer >> Ansoft Designer在线帮助文档 |
|
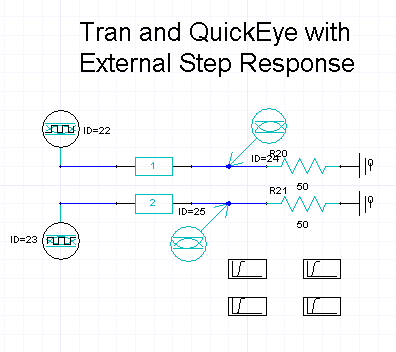
Nexxim Design Examples > Using External Step Response DataThe second project uses the step response data instead of repeating the transient analysis. Under the Design icon, click on the Transient External Step project:
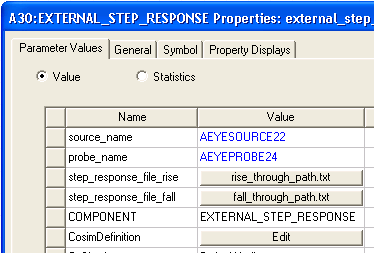
The circuit is basically the same, only now the responses will be controlled by the four External Step Response ESR) elements in the schematic. Click on the upper left ESR element and display its properties:
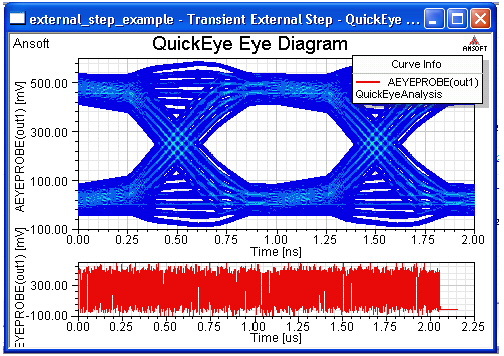
The ESR elements do not physically connect to the circuit. Each ESR element specifies a rise time and a fall time for one of the four paths: • The main through path from Eye Source 22 to Eye Probe 24 (out1). • The second through path from Eye Source 23 to Eye Probe 25 (out2). • The crosstalk path from Eye Source 22 to Eye Probe 25 (out2). • The crosstalk path from Eye Source 23 to Eye Probe 24 (out1). The two through paths use the same rise and fall data files. The two crosstalk paths share a different set of rise and fall data files. On the Project tree, expand the Analysis icon, right-click QuickEyeAnalysis, and select Analyze from the pull-down menu. The analysis runs to completion very quickly compared to the earlier transient analysis. Because the step data is provided, no transient analysis is run, saving significant time. Expand the Results icon and double-click on the QuickEye Eye Diagram report:
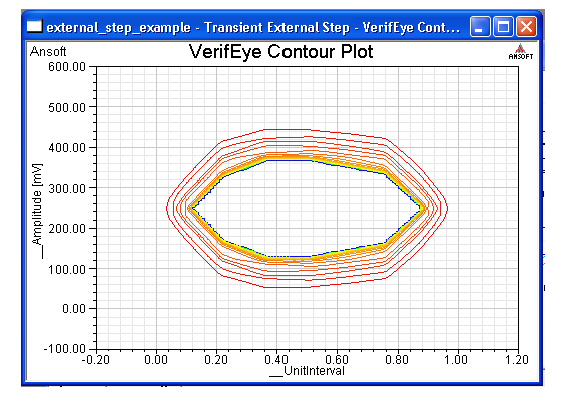
The result is nearly identical to the QuickEye Eye diagram produced by transient analysis. An equivalent speedup is available for VerifEye analysis as well. On the Project tree, expand the Analysis icon, right-click VerifEyeAnalysis, and select Analyze from the pull-down menu. This analysis also runs to completion quickly (much of the time is needed to generate the eye diagram). Providing the step data saves VerifEye some processing time. Expand the Results icon and double-click on the VerifEye Contour Plot report:
The result is identical to the VerifEye Contour diagram produced by transient analysis.
HFSS视频教程 ADS视频教程 CST视频教程 Ansoft Designer 中文教程 |
|
Copyright © 2006 - 2013 微波EDA网, All Rights Reserved 业务联系:mweda@163.com |
|