|
微波射频仿真设计 |
|
|
微波射频仿真设计 |
|
| 首页 >> Ansoft Designer >> Ansoft Designer在线帮助文档 |
|
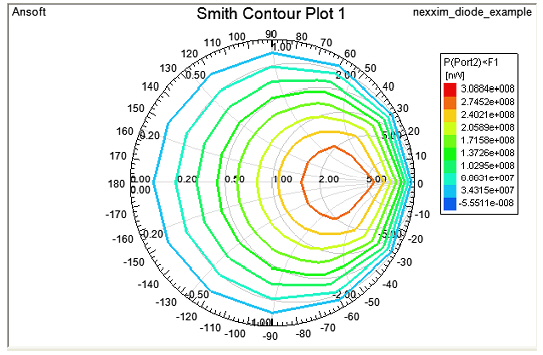
Nexxim Design Examples > Run the Loadpull Analysis and View the Results1. Right-click the HB1Tone setup icon and select Analyze. The Progress window displays a red line to show the analysis as it performs the sweeps. 2. When the analysis is complete, right-click on the Results icon in the Project tree and select Create LoadPull Report > Smith Contour Chart. 3. The Report dialog opens with the Trace tab selected. • Verify that HB1Tone is the Solution and Loadpull Contour is the Domain. • Select Power as the Category, P(Port2)<F1> as the Quantity, and <None> as the Function (loadpull results are automatically set in watts). • Click New Report, then click Close. 4. The Report window opens with a Smith Chart showing the contour plots of the sweep results:
5. Close the Report window and the Project when you have finished viewing the graph.
HFSS视频教程 ADS视频教程 CST视频教程 Ansoft Designer 中文教程 |
|
Copyright © 2006 - 2013 微波EDA网, All Rights Reserved 业务联系:mweda@163.com |
|