|
微波射频仿真设计 |
|
|
微波射频仿真设计 |
|
| 首页 >> Ansoft Designer >> Ansoft Designer在线帮助文档 |
|
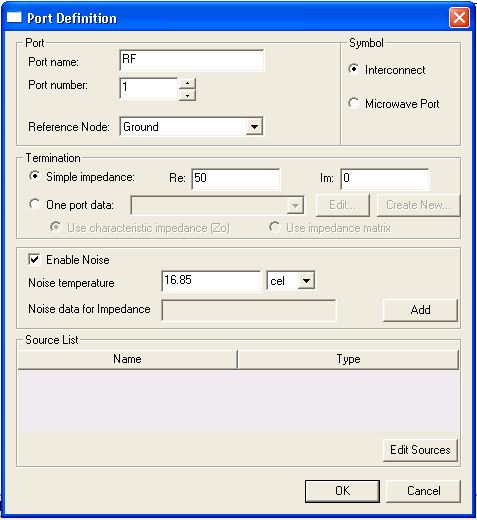
Nexxim Design Examples > Perform a Time-Varying Noise AnalysisTo enable periodic time-varying noise (TV noise) analysis, the input port definition should include noise data. 1. Right-click on the RF interface port at the left of the schematic and select Edit Port from the menu. The Port Definition dialog opens:
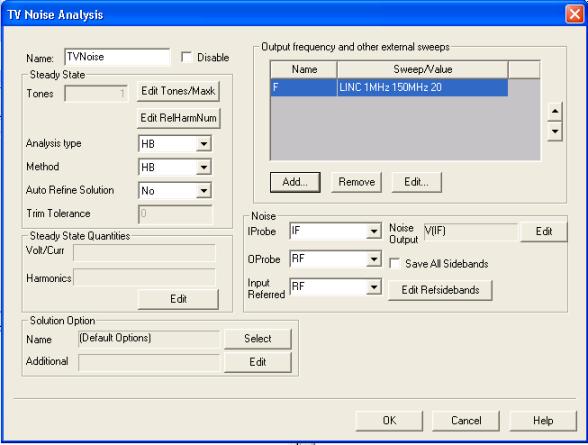
• Verify that the Enable Noise checkbox is checked as shown in the illustration above. • Click OK to close the Port Definition dialog. 2. Expand the Analysis icon and double-click the TVNoise analysis setup. The TV Noise Analysis dialog opens:
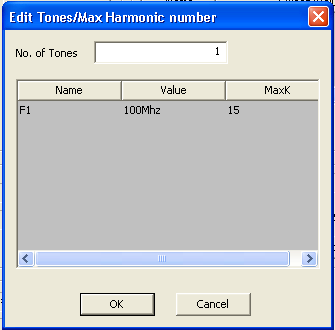
3. Verify that the Analysis Type is HB, the Method is HB, Auto Refine Solution is No, and the Trim Tolerance field is inactive (0). 4. Click the Edit Tones/Maxk button in the Steady State panel. 5. The Edit Tones/Max Harmonic Number dialog opens:
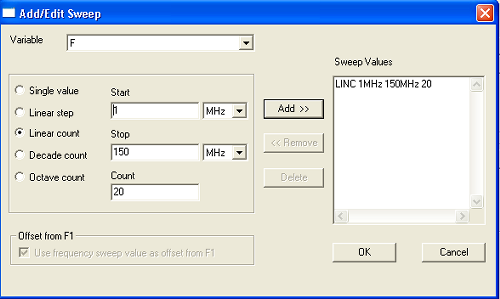
• The No. of Tones is 1. • F1 is the frequency for the harmonic balance calculations. The Value field is 100MHz. • 15 is the MaxK field. MaxK specifies the highest harmonic to use in the harmonic balance calculations that underlie the TV Noise analysis. • Click OK to close the Edit Tones/Max Harmonic Number dialog and return to the TV Noise Analysis dialog. 6. In the Output frequency and other external sweeps panel, click Edit. The Add/Edit Sweep dialog opens.
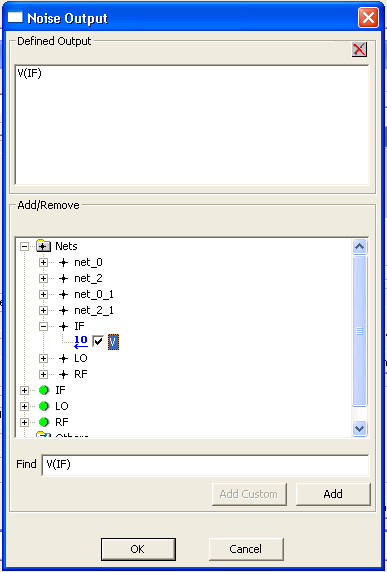
• Make sure F is showing in the Variable field. • Use the radio button to select Linear Count. • Enter 1 in the Start field. Use the pulldown to select MHz as the unit. • Enter 150 in the Stop field. Use the pulldown to select MHz at the unit. • Enter 20 in the Count field. • Click Add. The sweep specification appears in the Sweep Values display. • Click OK to close the Add/Edit Sweep dialog and return to the TV Noise Analysis dialog. 7. In the Noise panel, use the pulldowns to select RF as the IProbe and IF as the OProbe. 8. Click the Edit button on the Noise Output field to open the Noise Output dialog:
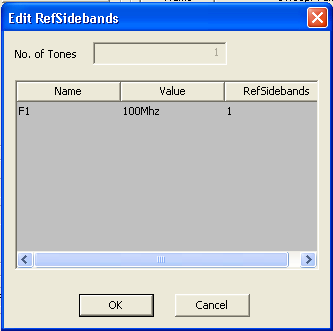
• Expand the Nets icon, then the IF icon, and then click the V box as shown in the figure above. Click Add. The entry V(IF) appears in the Defined Output field. • Click OK to close the Noise Output dialog and return to the TV Noise Analysis dialog. 9. Selecting a noise output enables the Input Referred field. Use the pulldown to select RF. 10. Click the Save All Sidebands box. Click the Edit Refsidebands button to view the sidebands settings:
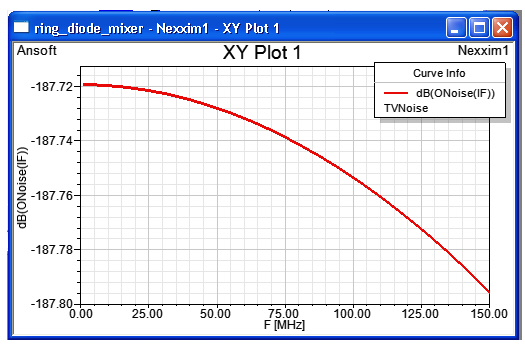
11. Click OK to close EditRefSidebands dialog. 12. Click OK to close the TV Noise Analysis dialog. 13. Expand the Analysis icon in the Project window, right-click the TVNoise solution setup, and select Analyze from the menu. The TV noise analysis runs. The Progress window displays a red line to show the progress of the analysis. When the analysis has completed, the results are available. We are interested in two results: the Noise Figure (NF) and the Power Conversion Gain (CG). 14. Right-click on the Results icon in the Project window and select Create Standard Report > Rectangular Plot. 15. The Report dialog opens with the Trace tab selected. • Select TVNoise from the Solution pulldown. • Select Noise from the Domain pulldown. • Select Noise in the Category list. • Select Onoise(IF) in the Quantity list. • Select dB in the Function list. • Click New Report. • Click Close to close the Report dialog. 16. The Report window opens with a graph of the result:
17. Right-click once more on the Results icon in the Project window and select Create Standard Report > Rectangular Plot. 18. The Report dialog opens with the Trace tab selected. • Select TVNoise from the Solution pulldown. • Select Noise from the Domain pulldown. • Select Power Conversion Gain in the Category list. • Select CG(V(IF)) in the Quantity list. • Select dB in the Function list. • Click New Report. • Click Close to close the Report dialog. 19. The Report window opens with a graph of the result:
HFSS视频教程 ADS视频教程 CST视频教程 Ansoft Designer 中文教程 |
|
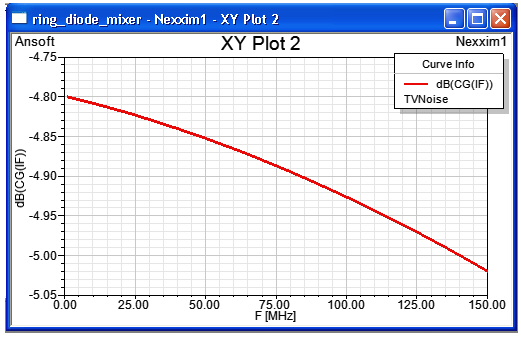
Copyright © 2006 - 2013 微波EDA网, All Rights Reserved 业务联系:mweda@163.com |
|