|
微波射频仿真设计 |
|
|
微波射频仿真设计 |
|
| 首页 >> Ansoft Designer >> Ansoft Designer在线帮助文档 |
|
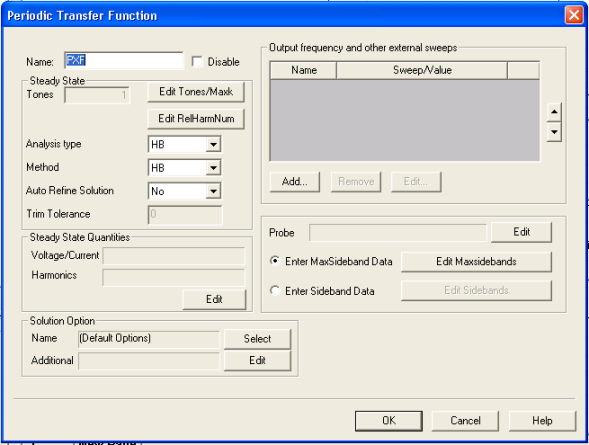
Nexxim Design Examples > Perform a Periodic Transfer Function AnalysisPeriodic transfer function (PXF) analysis computes the small-signal transfer function from selected voltage and current sources in the circuit to a specified single output at a frequency that can be swept. A steady-state HB or OSC analysis first computes the periodic or quasi-periodic operating point, on which the small-signal PXF analysis is calculated. In Nexxim, PXF analysis is an extension of time-varying noise analysis. We can use the ring diode mixer to demonstrate periodic transfer function analysis. 1. On the Circuit menu, select Add Nexxim Solution Setup > Periodic Transfer Function (PXF). 2. The Periodic Transfer Function setup dialog opens:
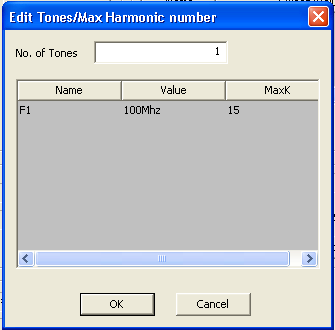
3. Verify that the Analysis Type is HB, the Method is HB, Auto Refine Solution is No, and the Trim Tolerance field is inactive (0). 4. Click the Edit Tones/Maxk button in the Steady State panel. 5. The Edit Tones/Max Harmonic Number dialog opens:
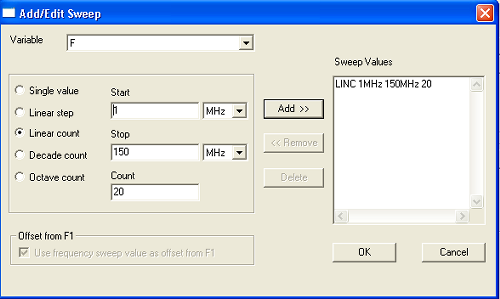
• Leave the default of 1 as the No. of Tones. • Click on the F1 line and click again on the Value field. Enter 100MHz in the Value field. The value sets the frequency for the harmonic balance calculations. • Enter 15 in the MaxK field. This specifies the highest harmonic to use in the harmonic balance calculations that underlie the Periodic Transfer Function analysis. • Click OK to close the Edit Tones/Max Harmonic Number dialog and return to the Periodic Transfer Function Analysis dialog. 6. In the Sweep Variables panel, click Add. The Add/Edit Sweep dialog opens.
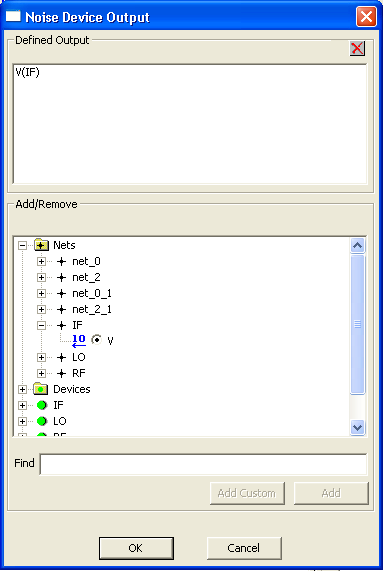
• Make sure F is showing in the Variable field. • Use the radio button to select Linear Count. • Enter 1 in the Start field. Use the pulldown to select MHz as the unit. • Enter 150 in the Stop field. Use the pulldown to select MHz at the unit. • Enter 20 in the Count field. • Click Add. The sweep specification appears in the Sweep Values display. • Click OK to close the Add/Edit Sweep dialog and return to the Periodic Transfer Function Analysis dialog. 7. Click the Edit button on the Probe field to open the Noise Device Output dialog:
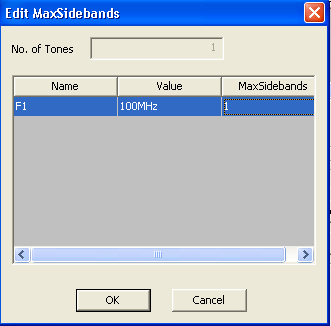
• Expand the Nets icon, then the IF icon, and then click the V box as shown in the figure above. Click Add. The entry V(IF) appears in the Defined Output field. • Click OK to close the Noise Device Output dialog and return to the Periodic Transfer Function Analysis dialog. 8. Click the Edit Maxsidebands button to open the Edit MaxSidebands dialog:
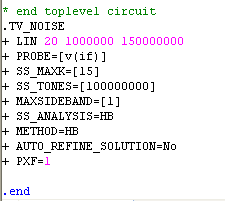
• The F1 and 100MHz values are automatically inserted in the dialog. • Click on the MaxSidebands field and enter 1. • Click OK to close the Edit MaxSidebands dialog and return to the Periodic Transfer Function Analysis dialog. • Click OK to close the Periodic Transfer Function Analysis dialog. 9. Select the Project tab in the Project window. Expand the Analysis icon and right-click the Periodic Transfer Function solution setup. Select Browse Netlist from the menu. The Netlist Editor opens to show the netlist that has been created for the circuit and the solution setup. Here is the solution setup:
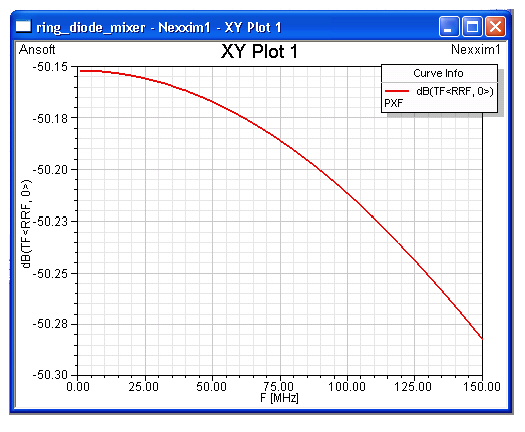
10. Right-click on the Periodic Transfer Function solution setup and select Analyze from the menu. The PXF analysis runs. The Progress window displays a red line to show the progress of the analysis. When the analysis has completed, the results are available. We can compare the PXF analysis result to the Power Conversion Gain (CG) from the TV Noise analysis. 11. Right-click on the Results icon in the Project tree and select Create Standard Report > Rectangular Plot. 12. The Report dialog opens with the Trace tab selected. • Select PXF from the Solution pulldown. • Select Transfer Function from the Domain pulldown. • Select Transfer Function in the Category list. • Select TF(RRF,0) in the Quantity list. • Select dB in the Function list. • Click New Report, then click Close to close the Report dialog and generate the report.
13. You can verify that this graph is identical to the Conversion Gain graph from the TV Noise analysis. 14. Close the Project when you are finished viewing the graph. 15. Exit Designer by selecting Exit from the File pulldown, or by clicking the X at the upper right of the Designer window. For more information, see Nexxim Time-Varying Noise Analysis.
HFSS视频教程 ADS视频教程 CST视频教程 Ansoft Designer 中文教程 |
|
Copyright © 2006 - 2013 微波EDA网, All Rights Reserved 业务联系:mweda@163.com |
|