|
微波射频仿真设计 |
|
|
微波射频仿真设计 |
|
| 首页 >> Ansoft Designer >> Ansoft Designer在线帮助文档 |
|
Nexxim Design Examples > Generating Impulse Response DataThe example design is available in the Examples directory. The design contains both parts of the example as separate projects. Open the design from its file in the Examples directory. 1. On the File menu, select Open Examples. The File Open window appears. 2. Open SI_Circuit, then select the file External_Step_Example.adsn. Click Open. The design opens with two projects:
Click on the Transient Computed Step project. The schematic appears
The circuit contains two Eye Sources and two Eye Probes. The through path from Eye Source ID=22 to Eye Probe ID=24 (out1) is the main channel. The through path from Eye Source ID=23 to Eye Probe ID=25 (out2) is the secondary (competing) channel). The two sources produce PRBS bit streams with different seeds. The paths from Eye Source ID=22 to Eye Probe ID=25 (out2) and from Eye Source 23 to Eye Probe ID=24 (out1) generate the crosstalk terms. On the Project tree, expand the Analysis icon, right-click QuickEyeAnalysis, and select Analyze from the pull-down menu. The analysis runs to completion. Expand the Results icon and double-click on the QuickEye Eye Diagram report:
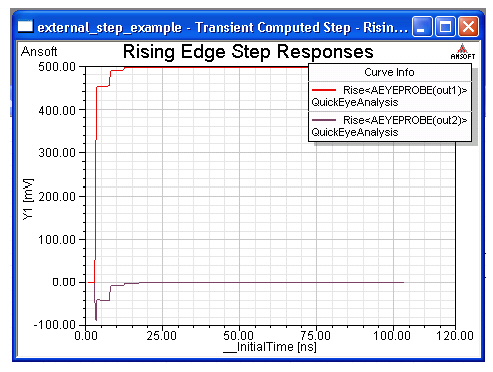
To view the rising step response data, double-click on the Rising Edge Step Responses report:
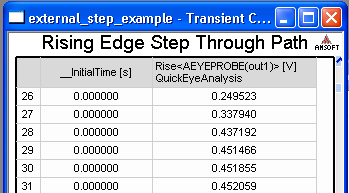
The upper trace is the main channel response. The lower trace is the crosstalk response. To view the step response data in tabular form suitable for exporting, double-click on the Rising Edge Step Through Path report:
The data window has been scrolled down to a segment with data.
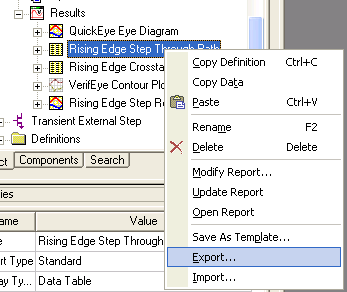
By default, the data would be in units such as nanoseconds and millivolts. The ESR component requires units of seconds and volts. To change to the units shown above, click on the column heading (e.g., _InitialTime) and set the Units property to the desired unit. The data from this table have been exported to step response files for the second part of this example. To export the data from the data table report, right-click on the report and select Export from the pull-down menu:
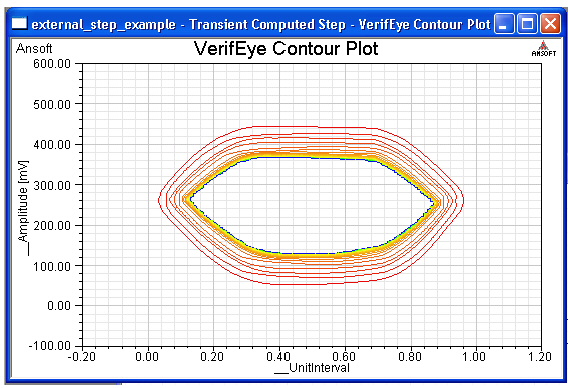
An Export to File dialog opens. Browse to the desired directory. Save the data using the Post processor format files (*.txt) format. The data file rise_through_path.txt in the Examples directory was created in this way. The data table report Rising Edge Crosstalk Response contains the response data for one crosstalk path, Eye Source ID=22 to EyeProbe ID=25 (out2). The exported data is in the data file rise_xtalk_term.txt in the Examples directory. Similar reports were generated and exported to create the data files fall_through_path.txt and fall_xtalk_term.txt in the Examples directory. In this simplified example, both through paths use the same rise and fall times, and the crosstalk terms are assumed to be the same in both crosstalk paths. The same analysis may be run using VerifEye instead of QuickEye. Under the Analysis icon, right-click VerifEye Analysis and select Analyze from the pull-down menu. The analysis runs to completion. To view the results: double-click on the VerifEye Contour Plot report:
HFSS视频教程 ADS视频教程 CST视频教程 Ansoft Designer 中文教程 |
|
Copyright © 2006 - 2013 微波EDA网, All Rights Reserved 业务联系:mweda@163.com |
|