|
微波射频仿真设计 |
|
|
微波射频仿真设计 |
|
| 首页 >> Ansoft Designer >> Ansoft Designer在线帮助文档 |
|
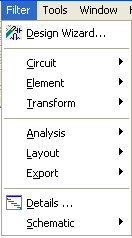
Filter Design Tool > Filter Design WindowFilter Design Tool has a customized window in which you can view circuit schematic and filter response. It is divided into two vertical views which can be resized by using the dragging the splitter control. When you maximize the window, the views are automatically adjusted to be equal in size. So if you want to split the window into two equal sizes, click Maximize and Restore in order. Design window handles commands passed by the mouse clicks and by all menu items under the Filter menu at the top of the Designer window:
Unless otherwise stated, throughout Filter Design Tool Help, all submenus and their items are under the Filter menu.
Schematic Window The view on the left of the Filter Design Window is called the Schematic window. You can select elements, edit their properties and make transformations on them. You can also delete selected elements or insert new ones from the menu. To select an individual element, click on the element. The selected element will be drawn in a different color. By pressing the Shift key, you can also select nonadjacent elements in the schematic. To select a range of elements (adjacent elements), click anywhere in the schematic and drag the mouse with the button still pressed. The selected elements will be drawn in a different color. After selecting the element(s), you can apply modifications using menu items under the Filter menu. You can also right-click on the schematic to access a shortcut menu. The shortcut menu is created on-the-fly and it contains some of the applicable commands for the current selection.
Plot Window The Plot window is placed on the right in the design window. You can view the results of the analysis as plotted. Since an analysis is performed after every change in the schematic, the plot window is always up-to-date. To change the plot type or analysis frequency range, click on menu items under the Filter>Analysis submenu. You can also right-click on the Plot and use the shortcut menu provided. If the plot window contains only one XY-graph, you can select and zoom in a region by using mouse. To zoom in frequency range, click on anywhere on the XY-graph, drag the mouse and leave the mouse button. An analysis in the selected frequency range will be performed and the plot will be updated.
The topics for this section include:
HFSS视频教程 ADS视频教程 CST视频教程 Ansoft Designer 中文教程 |
|
Copyright © 2006 - 2013 微波EDA网, All Rights Reserved 业务联系:mweda@163.com |
|