|
微波射频仿真设计 |
|
|
微波射频仿真设计 |
|
| 首页 >> Ansoft Designer >> Ansoft Designer在线帮助文档 |
|
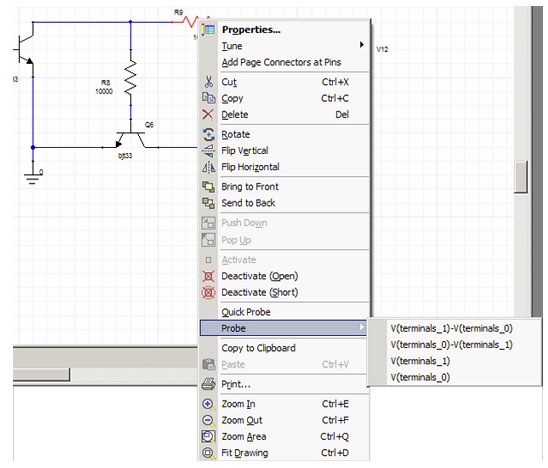
Generating Reports and Postprocessing > Plot-On-SchematicOne convenient way to generate a 2D report is to create a Plot-On-Schematic. A Plot-On-Schematic generates a standard 2D report but also associates it with the component being simulated. It then displays the plot alongside the component in the Schematic editor. After simulating an analysis, select a component in the Schematic editor, right-click over the component and highlight Probe. When you highlight the Probe menu item, a list of terminals that can be plotted is displayed (such as voltage across the component, voltage across the component, or various combinations of terminals). For larger pin components, more options will appear in the Probe list, such as voltage across various terminals (including collector-to-base, base-to-collector, individual terminals, and any current or power options). You can also generate a plot of a selected net, or a plot of multiple-selected nets. For instance, when you select two nets, a right-click option of Quick Probe will allow you to create a Plot-On-Schematic of V(firstNet)-V(secondNet).

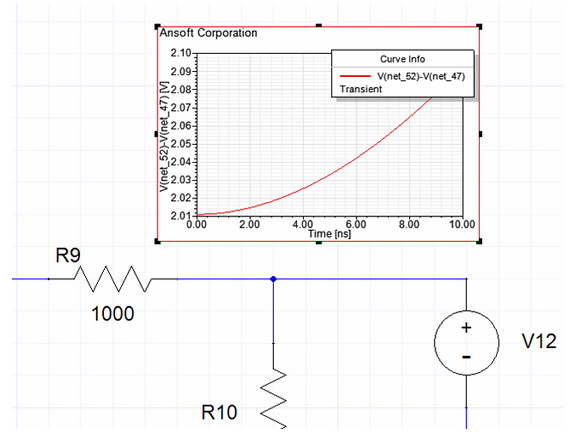
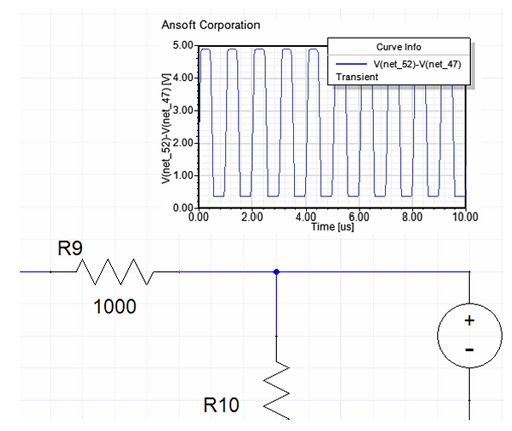
When you select an entry in the Probe list, the quantity is automatically plotted and placed on the schematic next to the selected component. The plot is associated with the component — as the component moves, the plots moves with it. (The plot can also be directly relocated by selecting and dragging.) • The created plot also shows up in the Results folder in the Project tree. • Each component/net/port can have only one plot associated with it. • You can have multiple plots on the same schematic, but only one such plot for each component.

If you right-click on a plot in the schematic, you can choose the Edit in Place option (same as double-clicking the plot). The plot then becomes fully editable.

• You can move the legend bar around, change the color of traces, or change scaling for X and Y-axis — every operation you can normally perform in a regular plot window. • You can also add plot markers. • When you “click out” of the plot, it reverts back to being another schematic object. • Plots are dynamically updated when you modify the analysis, so after you re-analyze, the Plot-On-Schematic is automatically updated as well.
For more information see Modifying Reports.
HFSS视频教程 ADS视频教程 CST视频教程 Ansoft Designer 中文教程 |
|
Copyright © 2006 - 2013 微波EDA网, All Rights Reserved 业务联系:mweda@163.com |
|