|
微波射频仿真设计 |
|
|
微波射频仿真设计 |
|
| 首页 >> Ansoft Designer >> Ansoft Designer在线帮助文档 |
|
Generating Reports and Postprocessing > New Report DialogWhen you left click Product > Results (or right-click Results in the Project tree) and select a report type and then a display type, a New Report dialog similar to the following opens:
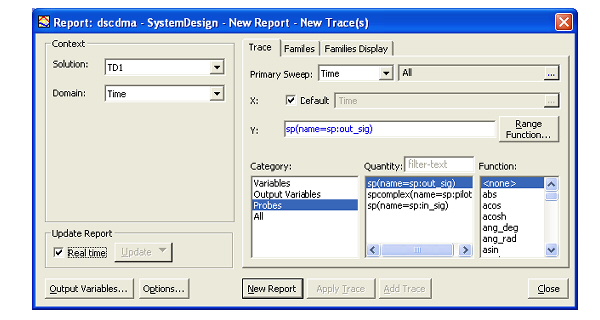
In the New Report dialog, you select options in the following sections to create a report:
Context section • Solution — lists the available sweeps. • Domain — lists the available domains. • Show — lists the quantity types to display. ( Differential Pairs only)
Harmonics section • For Harmonic Balance simulation setups (HB1Tone, HBNtone, Oscillator, OscillatorNTone, PXF, TVNoise) this section displays the first five harmonic quantities of a Sweep or Network Function domain. • Edit — You can select/filter and change the displayed harmonic quantities by clicking the Edit button to open the output quantity dialog; any changes that are made will be reflected in the original setup dialog.
Plotting Range section • Long-time domain simulations may contain extremely large amounts of data. • Windowing — trims the data. • Thinning — removes unecessary detail • Time Start — allows you to set the start time and units. • Time Stop — allows you to set the stop time and units.
Constellation Trace tab • Primary Sweep — pulldown menu allows you to select a primary sweep, or you can browse for the selection by clicking the ellipsis button at right (...). • Constellation — displays the applicable function. Contains a dropdown menu for selecting the value(s) and a browse button for selecting from a list of sweeps (if available). Clicking the Range Function button opens the Set Range Function dialog and allows you to choose a different function to apply. • Category window- these depend on the Solution type and the design. This lets you specify the category of information for the report. • Quantity — allows you to specify a quantity for the Constellation report. • Function — allows you to specify a function for the Constellation report.
Eye Diagram Trace tab • Primary Sweep — pulldown menu allows you to select a primary sweep, or you can browse for the selection by clicking the ellipsis button at right (...) • Eye Diagram — displays the applicable function. Contains a dropdown menu for selecting the value(s) and a browse button for selecting from a list of sweeps (if available). Clicking the Range Function button opens the Set Range Function dialog and allows you to choose a different function to apply. • Category window- these depend on the Solution type and the design. This lets you specify the category of information for the report. • Quantity — allows you to specify a quantity for the Eye Diagram report. • Function — allows you to specify a function for the Eye Diagram report.
Constellation Parameters section • Radio buttons allow you to choose between Vector and Constellation • When the Constellation radio button is selected, you may specify a Sample Period and Offset.
Eye Parameters section • Allows you to specify a Unit Interval and Offset.
• Real Time checked — enable real time updates for all reports. • Real Time unchecked — enables the adjacent drop down menu which allows you to choose Update This Report or Update All Reports. Both selections will update traces to the latest data available.
Trace tab • Primary Sweep — pulldown menu allows you to select a primary sweep, or you can browse for the selection by clicking the ellipsis button at right (...) • X: • Contains a dropdown menu for selecting the value(s) and a browse button for selecting from a list of sweeps (if available). • Y: • Range Function button — opens the Set Range Function dialog. This applies currently specified Quantity and Function. • Category window— these depend on the Solution type and the design. This lets you specify the category of information for the Y component. • Quantity — allows you to specify a quantity for the Y component. • Function — allows you to specify a function for the Y component.
Families tab • Lists the number of families available. • Each member of a family defines one point on a curve. • Radio buttons allow you to choose between Sweeps and Available variations. Allows you to edit sweeps; the Edit button lets you select variable Values. • Nominals field (disabled if none exist in the design) allows you to choose one of the following: • Set All Variables to Nominal • Set All Unswept Variables to Nominal • Choose Nominals
Families Display tab • Allows you to choose from the following types of families display: All Families, Statistics, or Histogram.
Dialog command buttons • Output Variables — opens the Output Variables dialog. • Options — opens the Report Setup Options dialog. This contains a checkbox for using the advanced mode for editing and viewing trace components. This mode is automatic if the trace requires it. It also contains a field for setting the maximum number of significant digits to display for numerical quantities. • New Report — adds a report to the Project tree under the Results icon. The new report is displayed in the Project window. • Apply Trace — applies the currently configured trace. • Add Trace — this is enabled when you have created or selected a report. You can add further traces. The new trace displays in the Project window under the report. • Close — closes the New Report dialog.
HFSS视频教程 ADS视频教程 CST视频教程 Ansoft Designer 中文教程 |
|
Copyright © 2006 - 2013 微波EDA网, All Rights Reserved 业务联系:mweda@163.com |
|


