|
微波射频仿真设计 |
|
|
微波射频仿真设计 |
|
| 首页 >> Ansoft Designer >> Ansoft Designer在线帮助文档 |
|
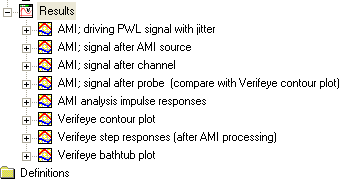
Nexxim Design Examples > Channel Example with VerifEyeWe can use the same project, AMI_Example.adsn, to compare the AMI analysis with VerifEye analysis using the AMI impulse response definitions. 1. Double-click on the VerifEye Analysis setup: 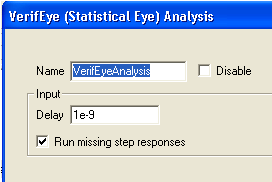 This is the default setup for VerifEye. 2. Right-click on the VerifEye Analysis setup and select Analyze. The VerifEye analysis runs to completion. 3. Expand the project tree to show the Reports:
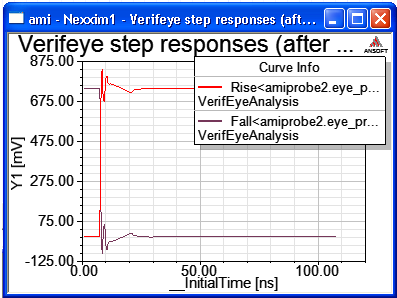
4. Double click on VerifEye step responses to open the report showing the step responses as calculated by VerifEye using the FFE tap weights in the Source or Probe by FFE method 1. With method 1, the FFE taps are applied to the impulse response and are reflected on this graph. Because VerifEye uses only the AMI_Init function, only Method 1 guarantees that the results with VE will be the same as the results for AMI analysis.
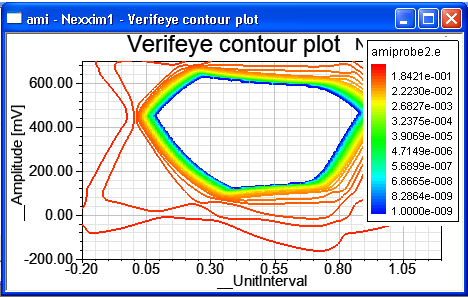
5. Double click on VerifEye contour plot to open the report showing the VerifEye contour plot of the of the output signal.
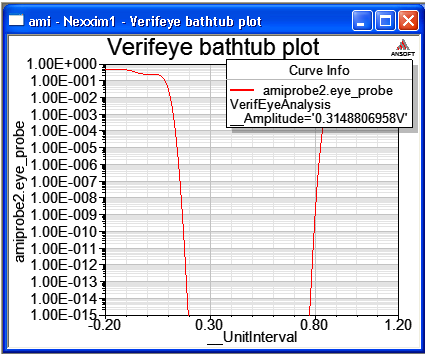
Double click on VerifEye bathtub plot to open the report showing the VE data as a bathtub plot.
HFSS视频教程 ADS视频教程 CST视频教程 Ansoft Designer 中文教程 |
|
Copyright © 2006 - 2013 微波EDA网, All Rights Reserved 业务联系:mweda@163.com |
|