|
微波射频仿真设计 |
|
|
微波射频仿真设计 |
|
| 首页 >> Ansoft Designer >> Ansoft Designer在线帮助文档 |
|
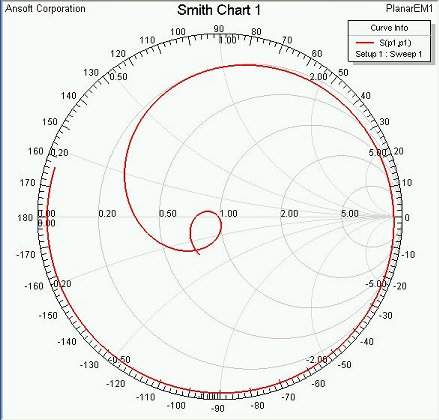
Getting Started with Ansoft Designer > Plot a User Defined GraphDisplay a Smith chart for S(p1, p1): 1. Do either of the following to create a report: • On the EM Design menu, point to Results, and then click Create Standard Report > Smith Chart. • In the Project Manager, right-click Results, and then click Create Standard Report > Smith Chart. 2. The Report dialog opens with the Trace tab selected. 3. In the Solution list, select Setup1:Sweep1. 4. In the Category and Quantity lists, select S Parameters and S(p1, p1), and make sure that None is selected in the Function list. 5. Click New Report. 6. Click Close. The Smith chart appears.
HFSS视频教程 ADS视频教程 CST视频教程 Ansoft Designer 中文教程 |
|
Copyright © 2006 - 2013 微波EDA网, All Rights Reserved 业务联系:mweda@163.com |
|