|
微波射频仿真设计 |
|
|
微波射频仿真设计 |
|
| 首页 >> Ansoft Designer >> Ansoft Designer在线帮助文档 |
|
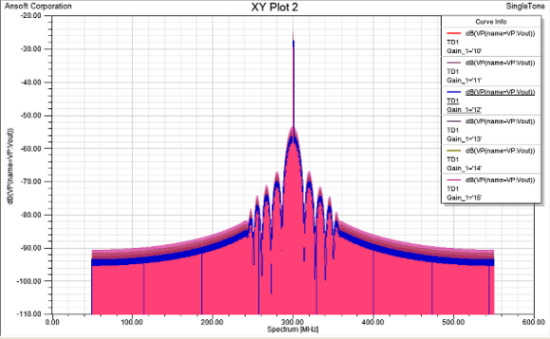
Getting Started with Ansoft Designer > Display Results for the Time-Domain AnalysisAt this point we’ve successfully run a time-domain analysis (TD1). Now we’ll display the results. In this case, we will plot the spectrum variations when the gain of the fourth amplifier is swept (a local variable, Gain_1, was set up and assigned to in steps 18 and 21).
To report the results for TD1: 1. On the System menu, click Create Standard Report > Rectangular Plot. Also note these two alternative ways to insert a report: • In the Project Manager window, right-click the Results icon, then point to Create Standard Report > Rectangular Plot. The Report dialog opens with the Trace tab selected. 2. In the Trace tab, plot the spectrum for the output-voltage probe (Vout): a. In the Solution list, select TD1. b. In the Domain list, select Spectral. c. Add the trace data: In the Category, Quantity, and Function lists, select Probes, VP(name=VP:Vout), and dB respectively. Click New Report. The resulting data for the first parameterization of the variable Gain_1 is displayed. 3. To plot the results with a different parameterized value for Gain_1: a. Select the Families tab in the Report dialog. b. Select the variable Gain_1 and click [...] to configure the values to be graphed. c. Select Use All Values. d. Click Apply Trace. The remaining parameterizations are added to the plot. e. Click Close to close the Report dialog.
4. To see how the spectral plot varies for various values of gain — for example, 10 dB or 13 dB — hover the mouse over the different traces displayed in the view Curve Info key. 5. Right-click anywhere in the Reports window, then select Zoom In. Next, press and hold the left mouse button down, drawing a box around an area of interest to magnify.
For more information on report types and controls, see Generating Reports and Postprocessing.
HFSS视频教程 ADS视频教程 CST视频教程 Ansoft Designer 中文教程 |
|
Copyright © 2006 - 2013 微波EDA网, All Rights Reserved 业务联系:mweda@163.com |
|