3D Vector Plot
 Properties
You can use 3D vector plots to display three-dimensional fields
as arrows or hedgehog. You may also display 2D cuts from 3D fields by
choosing the option 3D fields on 2D plane
or the corresponding item from the .
Plot type frame
Arrows:
Uses arrows pointing in the direction of the field. The size and the color
of the arrows relates to the field strength.
Cones:
Uses cones pointing in the direction of the field. The size of the cones
relates to the field strength. Color:
Colors the arrows depending on their value.
Hedgehog:
Uses lines to show the field direction, the line length and color relate
to the field strength.
Field lines:
Draws field lines starting from given seed points. The color relates to
the field strength. Before activating this plot type, faces or points
can be picked in the modeling view to define seed points. For power flow
results, seed points will be placed at the ports automatically, if no
faces or points are picked.
Note: In default engine mode, this feature uses
the new visualization engine.
Phase/Animation (Time/Animation) frame
Phase / Time:
Specify the phase in degrees for frequency monitors or time in your unit
in case of time monitors.
Start / Stop:
Click here to start or stop the animation.
Settings&ldots;:
Opens a dialog box where you can specify field
animation settings like step width.
Objects frame
Sparse / Dense
slider: Influences the number of arrows/lines used for the plot.
Scaling slider:
The slider defines the scaling for arrow size, hedge hog length or field
line radius.
log:
Turns on logarithmic scaling.
Strength:
You can vary the characteristic curve used for logarithmic scaling. Values
from 1.0e-6 to 100000 are allowed. A large strength value will give all
arrows nearly the same size, while a strength close to 0 will result in
a practically linear plot.
Logarithmic scaling will not change the maximum
arrow size selected by the slider.
Close
Closes this dialog box without performing any
further action.
Apply
Applies any changes to the visualization. Only
active if changes have been made.
Specials...
Opens a dialog box for special
settings.
Color ramp...
Opens a dialog box offering the possibility
to change the coloring of the
field plots.
Help
Shows this help text.
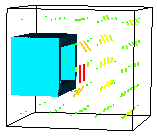
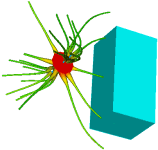
Example
3D vector plot using arrows (left), hedgehog
(mid) and field lines (right):
See also
2D/3D
Plot Overview, Post
Processing Overview,
3D
Scalar Plot, 2D
Vector Plot, 3D
Fields on 2D Plane, 3D
Vector Plot Special Settings


HFSS视频教程
ADS视频教程
CST视频教程
Ansoft Designer 中文教程
|