Excitation Signal View

The Excitation Signal View enables the visualization of all excitation functions in the project. It allows the creation of a new excitation function either via user-input or via import from the signal library. The existing signals may be renamed, deleted or added to the signal library.

A default transient analysis uses a single signal as stimulating excitation. This signal is called the "Reference Signal" and is indicated by the icon The context menu allows the choice of one of the existing signals as reference. When several signals are defined they can be associated with sources in the Excitations... subdialog of the time-domain solver dialogs.
Please note:
Sources which are not explicitly connected to another excitation will automatically be associated with the active Reference signal on solver start. When the Reference signal changes, these automatic connections will change as well without the need of reentering the Exciations dialog.

Further settings for the excitation signals can be changed in the Properties Dialog Box and for the 1D plots in the 1D Plot Properties Dialog Box. The displayed excitation functions can manually be selected via the Curve Selection Dialog Box.

Modifying excitation signals

Copy: Copies a 1D result curve to the clipboard.

Delete: Deletes an excitation function. If the deleted function was defined as reference, another signal is automatically chosen as reference.

Rename: Renames the selected excitation function.

Use as Reference: Select the chosen excitation signal as stimulating excitation.

Add to Signal Library: Exports the selected excitation signal to the signal library. If the name of the signal already exists inside the library, another name is automatically generated or the name can be changed manually.

Tree Appearance

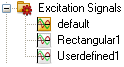
The example tree shows some excitation signals, where the "default" signal is defined as reference.

One of the signals is userdefined. Executing the Main program of the VBA-macro (which is generated automatically when the signal is edited the first time) inserts an additional branch in the tree with the plot of the userdefined signal (userdefined_plot).

See also

Navigation Tree Overview, Excitation Signal, Excitation Functions