|
微波射频仿真设计 |
|
|
微波射频仿真设计 |
|
| 首页 >> Ansoft Designer >> Ansoft Designer在线帮助文档 |
|
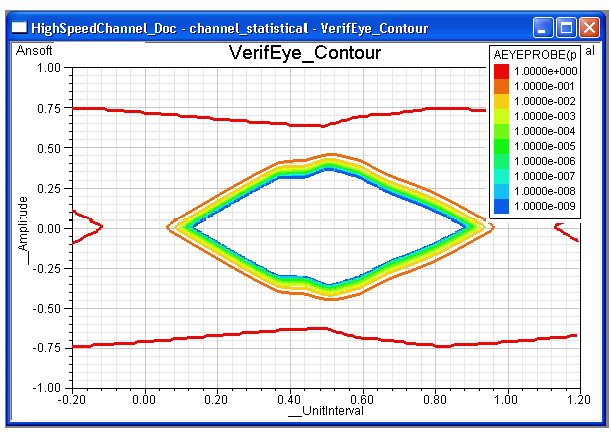
Nexxim Simulator > VerifEye Analysis OutputsTo display the results of a VerifEye analysis, click on the Results icon in the Project tree and select one of the Create Report options. There are several ways to display the data; this topic has examples of 2D Contour, 2D Bathtub, and 3D Bathtub plots of the bit error rate (BER) calculations, graphs showing the Initial Step Response and selected Eye Measurements, a data table of BER based on the Eye Measurements, and a data table report of the VerifEye data. 2D Contour Plot The contour plot of the bit error rate at times within the unit interval. To view the data as a contour plot of the bit error rate, select Create Standard Report>Rectangular Contour Plot. On the Report dialog, select UI as the Domain and Eye as the Category. Click New Report.
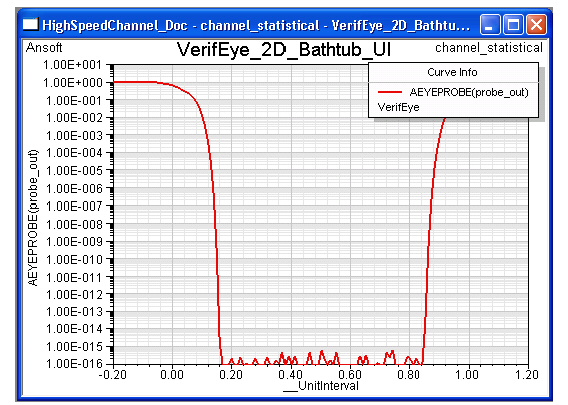
The contours for AEYEPROBE represent the bit error rates using logarithmic scaling. Amplitude represents the voltage transitions and UnitInterval is the location of the data relative to the unit interval. 2D Bathtub Plot To view the VerifEye data as a 2D bathtub curve, select Create Standard Report>Rectangular Plot. On the Report dialog, select UI as the Domain and Bathtub as the Category. Click New Report. .
This graph shows the BER at various locations in the unit interval. The amplitude is set at the midpoint of its value range. The BER values are on the Y-axis using logarithmic scaling and a minimum of 1e-16. This represents a horizontal slice of the BER through the center of the eye.
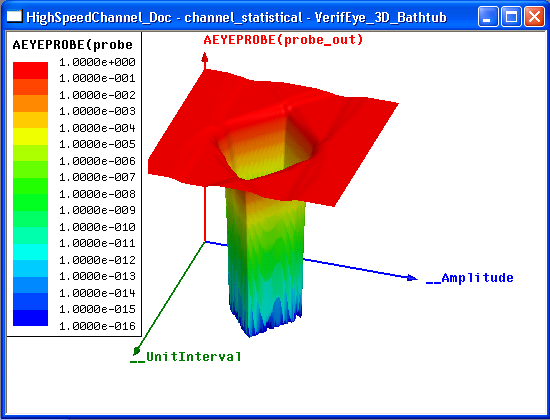
The BER bathtub plot can show the BER over all values of the Amplitude, using the midpoint of the Unit Interval. • Right-click anywhere in the report and select Modify Report. • Click the checkbox Use midpoint of and the radio button Unit Interval. Click Apply Trace. The report changes to show the BER plotted against the values of Amplitude with the UI held at its midpoint. This graph represents a vertical slice of the BER through the center of the eye.. 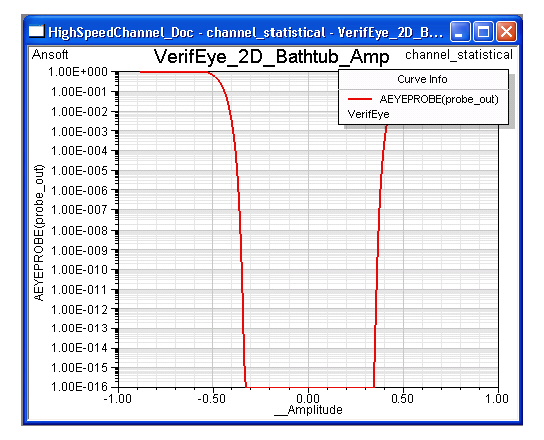 This represents a vertical slice of the BER through the center of the eye. To restore the BER bathtub plot to the midpoint of the Amplitude: • Right-click anywhere in the report and select Modify Report. • Click the checkbox Use midpoint of and the radio button Amplitude. Click Apply Trace. The report changes to show the BER (the AEYEPROBE axis in the example) plotted against displacement in the unit interval. • Alternatively, use the Families tab to select a value in the Amplitude range where the BER values are to be sampled. 3D Bathtub Plot To view the Amplitude bathtub curve as a 3D plot, select Create Standard Report>3D Rectangular. On the Report dialog, select VerifEye as the Solution, UI as the Domain, and Bathtub as the Category. Click New Report. :
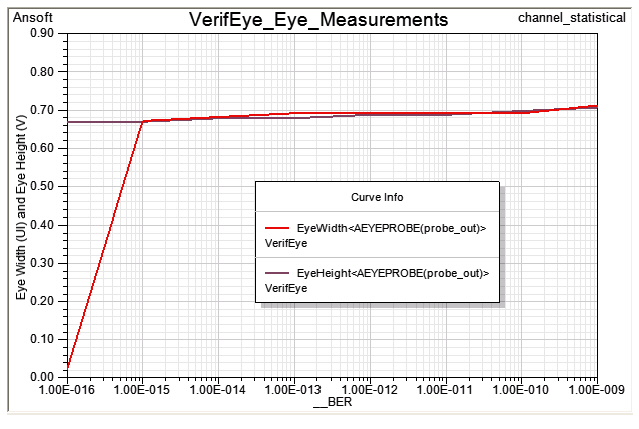
The values for AEYEPROBE are the bit error rates using logarithmic scaling. Amplitude represents the voltage transitions and UnitInterval is the location of the data relative to the unit interval. 2D Step Response Plot To display the initial step response of the channel: • Under Reports, select Create Standard Report>Rectangular Plot. • Use the Domain pulldown to select Initial Reponse. Click New Report. The report shows the initial response of the channel in the time domain  Eye Measurements To plot the eye width and height measurements against the bit error rate: • Under Reports, select Create Statistical Eye Report>Rectangular Plot. • Use the Domain pulldown to select Eye Measurement. Use the CTRL key to select both Eye Width and Eye Height in the Quantities list. • Click New Report. The report shows the eye width and height plotted against the bit error rate.
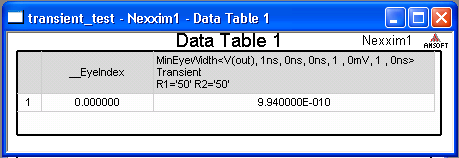
The BER axis has been changed to a logarithmic scale. Eye Measurement Data Table To generate a data table for the eye measurement report after VerifEye analysis has run to completion, left-click on the Results icon and select Create Statistical Eye Report>Data Table. Select your Transient analysis as the Solution, Eye Measurements as the Domain, Eye as the Category, your eye measurement (MinEyeWidth or MinEyeHeight) as the Quantity, and <none> as the Function. Click New Report to generate the plot. A very small eye measurement may be displayed as zero in Decimal format. On the table, click the value under the eye measurement to open its properties window, and change the Number Format to Scientific to see the value. Here is an example:
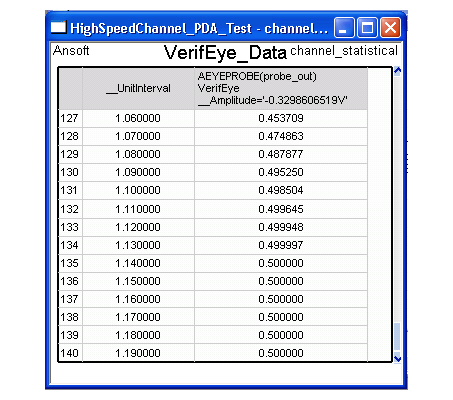
VerifEye Data Table To display the VerifEye data as a table, select Create Standard Report>Data Table from the Results menu. Select Bathtub as the Category, the name of the Eye probe as the Quantity, and <None> as the Function. Click New Report.
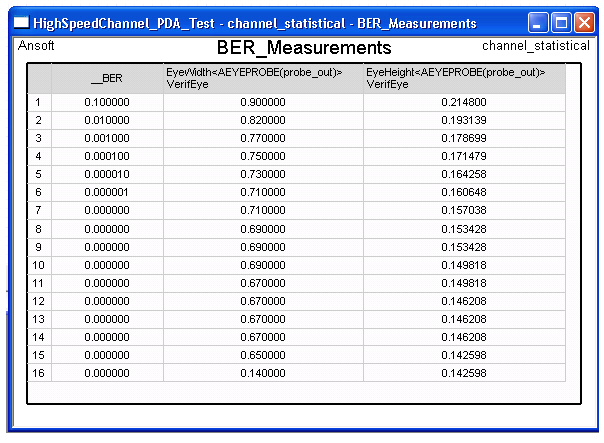
Bit Error Rate Data Table To display the Bit Error Rate (BER) information as a table, select Create Statistical Eye Report>Data Table from the Results menu. Select Eye Measurement as the Domain, Eye as the Category, Eye Width and Eye Height under Quantity, and <None> as the Function. Click New Report.
Related Topics Creating Eye Diagrams in the Reports topic. Eye Measurements in the Reports topic.
HFSS视频教程 ADS视频教程 CST视频教程 Ansoft Designer 中文教程 |
|
Copyright © 2006 - 2013 微波EDA网, All Rights Reserved 业务联系:mweda@163.com |
|