|
微波射频仿真设计 |
|
|
微波射频仿真设计 |
|
| 首页 >> Ansoft Designer >> Ansoft Designer在线帮助文档 |
|
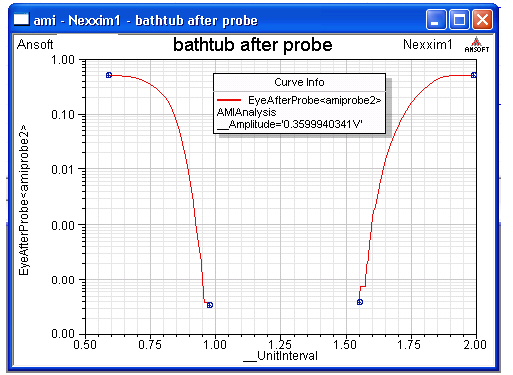
Nexxim Simulator > AMI Bathtub ChartsThe report can show bathtub curves of the Bit Error Rate (BER) at four points in the circuit: • The Initial Waveform shows the Piecewise Linear data input to the transmitter, including any jitter. • The Waveform After Source shows the output from the transmitter. • The Waveform After Channel shows the input to the receiver. • The Waveform After Probe shows the output from the receiver. To plot the bathtub diagram, select Create Standard Report>Rectangular Plot. Select your AMI Analysis as the Solution; UI as the Domain; InitialWaveform, EyeAfterSource, EyeAfterChannel, or EyeAfterProbe as the Quantity; and <none> as the Function. The chart below shows the BER bathtub curve after the Probe
Related Topics Creating Eye Diagrams in the Reports topic. Eye Measurements in the Reports topic
HFSS视频教程 ADS视频教程 CST视频教程 Ansoft Designer 中文教程 |
|
Copyright © 2006 - 2013 微波EDA网, All Rights Reserved 业务联系:mweda@163.com |
|