|
微波射频仿真设计 |
|
|
微波射频仿真设计 |
|
| 首页 >> Ansoft Designer >> Ansoft Designer在线帮助文档 |
|
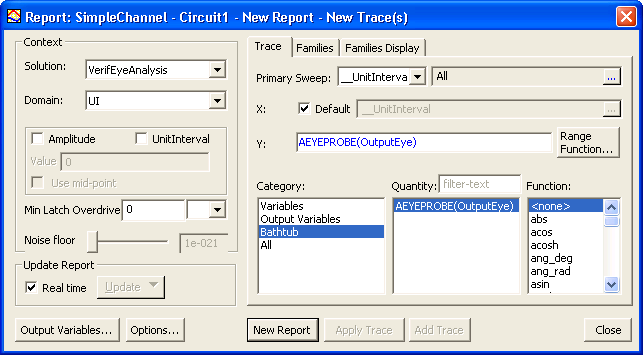
Getting Started with Ansoft Designer > Display the VerifEye and QuickEye ResultsWe shall employ three report types that are common in signal integrity (SI) studies: a bathtub plot and a contour diagram to display the results of the VerifEye analysis, and an eye diagram for the QuickEye results. To create a bathtub plot of the VerifEye data: 1. click the Results icon and select Create Standard Report > Rectangular Plot. The Report dialog opens.
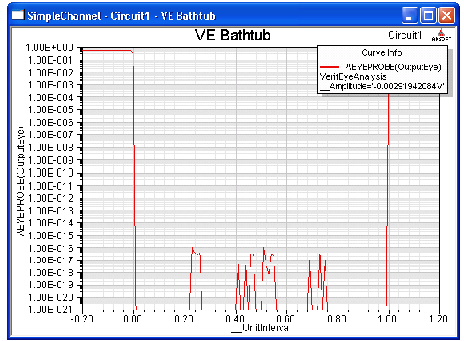
2. The Context panel should already have VerifEyeAnalysis as the Solution and UI as the Domain. 3. The X-axis (primary sweep) will be the UI time values. For the Y-axis, select the Bathtub category, the AEYEPROBE(OutputEye) quantity, and the <none> function, then click New Report. The Reports window opens with the graph of the bit error rates calculated by VerifEye over the Unit Interval:
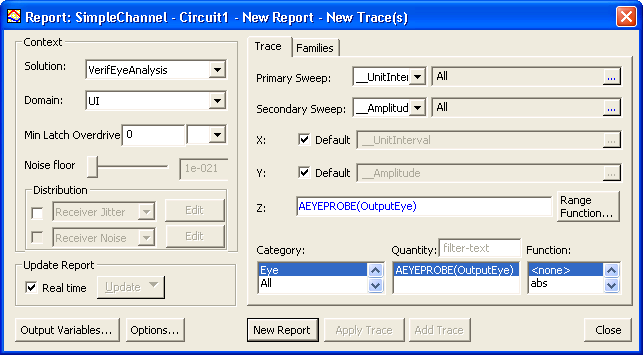
4. Click Close to close the Report dialog. 5. Click on the XYPlotn icon in the Results folder and rename it to VE Bathtub as in the example above. To display the results of the VerifEye analysis of the channel as a contour plot: 1. Click the Results icon and select Create Standard Report > Rectangular Contour Plot. The Report dialog opens.
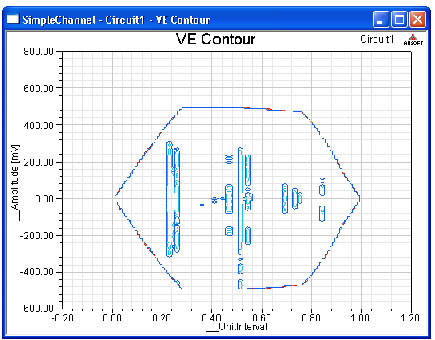
2. Retain VerifEyeAnalysis as the Solution and UI as the Domain. 3. The X-axis (primary sweep) will be the UI time values. The Y-axis is the amplitude values. For the Z-axis, select the Eye category, the AEYEPROBE(OutputEye) quantity, and the <none> Function, then click New Report. The Reports window opens with the graph of the bit error rate as a contour diagram:
4. Click Close to close the Report dialog. 5. Click on the RectangularContourPlotn icon in the Results folder and rename it to VE Contour as in the example above. To display the results of the QuickEye analysis of the channel as an eye diagram: 1. Click the Results icon and select Create Eye Diagram Report > Rectangular Plot. The Report dialog opens.
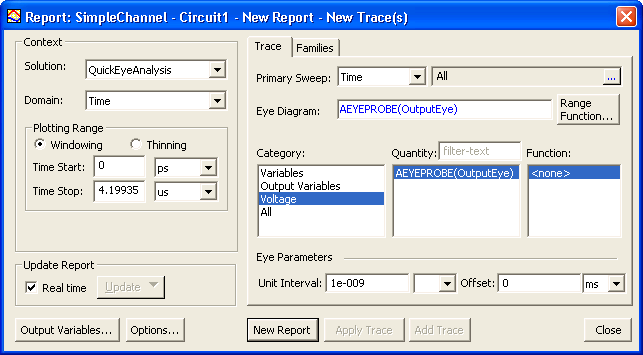
2. Accept QuickEyeAnalysis as the Solution, Time as the Domain, 3. Accept the Plotting Range values calculated by Nexxim. 4. Accept 1e-009 as the Unit Interval. 5. The primary sweep will be the UI time values.Select the Voltage category, the AEYEPROBE(OutputEye) quantity, and the <none> Function, and then click New Report. The Reports window opens with the eye diagram of the QuickEye data:
6. Click Close to close the Report dialog. 7. Click on the XYPlotn icon in the Results folder and rename it to QE Eye as in the example above. 8. On the Designer File menu, click Save to save your completed project. The Eye Source can specify transmit parameters such as jitter and equalization. In this brief tutorial, we will give just one example: adding random (Gaussian) transmit jitter.
HFSS视频教程 ADS视频教程 CST视频教程 Ansoft Designer 中文教程 |
|
Copyright © 2006 - 2013 微波EDA网, All Rights Reserved 业务联系:mweda@163.com |
|