|
微波射频仿真设计 |
|
|
微波射频仿真设计 |
|
| 首页 >> Ansoft Designer >> Ansoft Designer在线帮助文档 |
|
Getting Started with Ansoft Designer > Display the Transient and Harmonic Balance ResultsTo display the results of the transient analysis: 1. click the Results icon and select Create Standard Report > Rectangular Plot. The Report dialog opens.
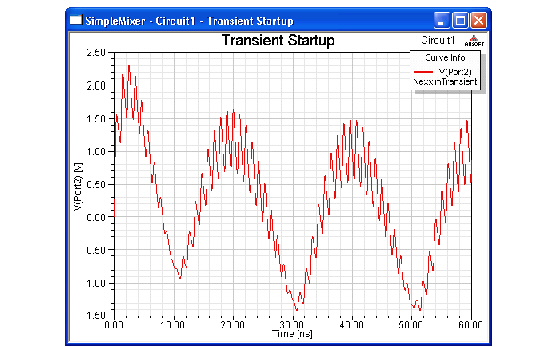
2. The Context panel should already have Nexxim Transient as the Solution and Time as the Domain. 3. The X-axis (primary sweep) will be the time values. For the Y-axis, select the Voltage category, then the V(Port2) quantity, using the <none> Function (to report the untransformed real value), and then click New Report. The Reports window opens with the graph of the mixer start-up at output Port 2 in the time domain:
4. Click Close to close the Report dialog. 5. Click on the XYPlotn icon in the Results folder and rename it to Transient Startup as in the example above. To display the results of the harmonic balance analysis with the steady-state output of the mixer: 1. Click the Results icon and select Create Standard Report > Rectangular Plot. The Report dialog opens.
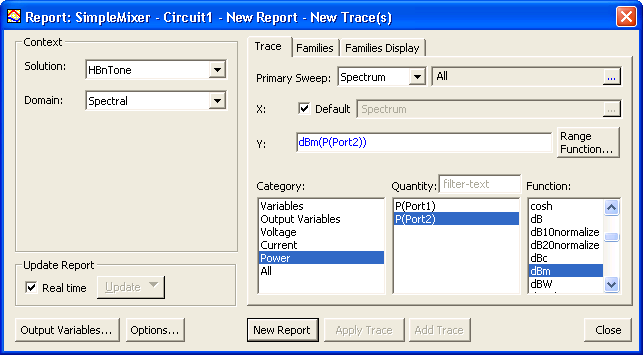
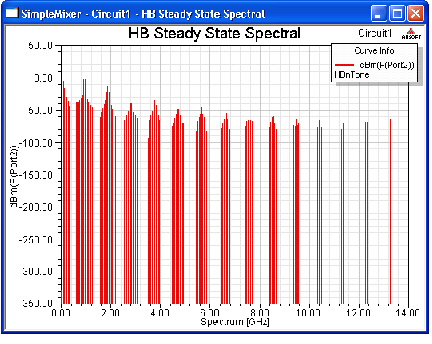
2. Select HBnTone as the Solution and Spectral as the Domain. 3. The X-axis (primary sweep) will be the frequencies. For the Y-axis, select the Power category, the P(Port2) quantity, and the dBm Function, and then click New Report. The Reports window opens with the graph of the mixer steady-state output at Port 2 in the spectral or frequency domain:
4. Click Close to close the Report dialog. 5. Click on the XYPlotn icon in the Results folder and rename it to HB Steady State Spectral as in the example above. To display the results of the harmonic balance analysis of the output of the mixer at startup, in the time domain: 1. Click the Results icon and select Create Standard Report > Rectangular Plot. The Report dialog opens.
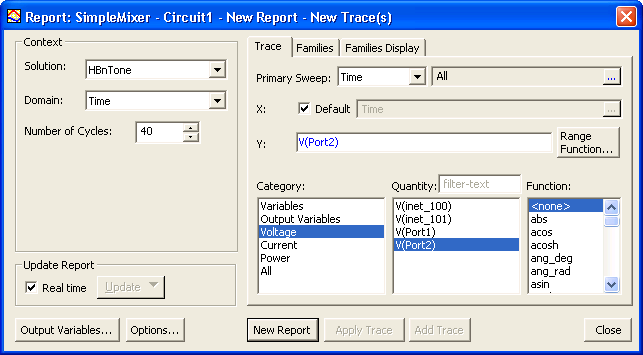
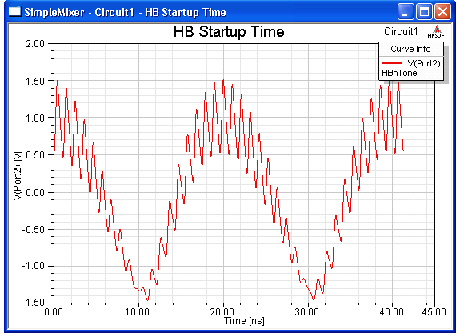
2. Select HBnTone as the Solution and Time as the Domain. 3. The X-axis (primary sweep) will be the time. For the Y-axis, select the Voltage category, the V(Port2) quantity, and the <none> Function, and then click New Report. The Reports window opens with the graph of the mixer start-up output at Port 2 in the time domain:
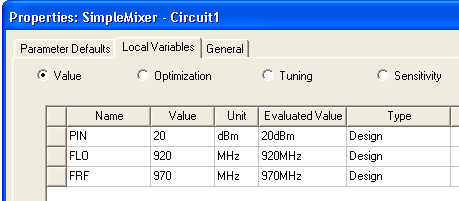
4. Click Close to close the Report dialog. 5. Click on the XYPlotn icon in the Results folder and rename it to HB Startup Time as in the example above. 6. On the Designer File menu, click Save to save your completed project. Using the Project Variables The use of project variables PIN for the power input, FLO for the carrier frequency, and FRF for the signal frequency allows you to easily change these values. To modify the value of a project variable, click the Circuit button at the top of the Designer window, and select Design Properties. Click the Local Variables tab:
Use the Value fields to assign new values to the variables.
HFSS视频教程 ADS视频教程 CST视频教程 Ansoft Designer 中文教程 |
|
Copyright © 2006 - 2013 微波EDA网, All Rights Reserved 业务联系:mweda@163.com |
|