|
微波射频仿真设计 |
|
|
微波射频仿真设计 |
|
| 首页 >> Ansoft Designer >> Ansoft Designer在线帮助文档 |
|
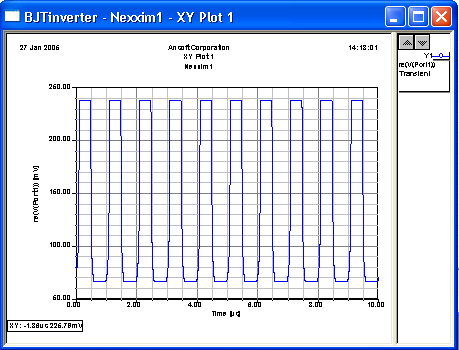
The Designer Desktop > Report WindowWhen a design has been successfully simulated, you can generate a report of results in a wide variety of forms, including XY graphs, polar graphs, 3D graphs, Smith charts, and data tables. Various attributes of each can be customized to your liking. Here is an example of a 2D Report:
For more information, see Generating Reports and Postprocessing.
HFSS视频教程 ADS视频教程 CST视频教程 Ansoft Designer 中文教程 |
|
Copyright © 2006 - 2013 微波EDA网, All Rights Reserved 业务联系:mweda@163.com |
|