|
|
|
| 首页 >> CST教程 >> CST2013在线帮助系统 |
Thermal Transient Result OverviewThe transient solver creates many 1D results and the start solution result automatically after the simulation process was finished. To get time-dependent temperature- or heat flow density-fields it is necessary to define field monitors before the solver is started.
1D Results Convergence The convergence curve shows the residual of the linear or nonlinear solver versus iteration step for the computation of the start solution. The gradient of the curve indicates if the linear equation system is well conditioned or not. This curve is created automatically.
Timescale This curve shows the current time for a given iteration step number. Integrating the "Timesteps" curve delivers the "Timescale" curve. This curve is created automatically.
Timesteps This plot shows the time-step size versus the step number of the integration scheme. If the time step is small rapid transient changes are probably taking place - for instant if a source is steep ramped up with a time signal. This curve is created automatically.
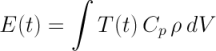
Energy During the simulation process the thermal energy inside all regions with a finite heat capacity is integrated and recorded.
with: E(t): time dependent energy T(t): time dependent temperature Cp: heat capacity rho: density dV: volume element
This curve is created automatically.
Power This curve shows the total amount of power entering all regions with a finite heat capacity.
with: Pstored: Power stored in the structure Ploss: Power added by external loss distributions Pcond: Power lost by thermal conduction to PTC regions. If power is added through PTC regions this is a negative value. Prad: Power lost by radiation Pconv: Power lost by convection
The power-curve is the derivative of the energy-curve with respect to the time. This curve is created automatically.
Temperature0D This folder stores all temperature curves vs. time on points previously defined with the Monitor at Point tool.
Heatflow The Heatflow folder contains the heatflow curves vs. time for all temperature and heat sources on PTC objects. These curves are created automatically.
Temperature The Temperature folder contains the temperature curves vs. time for all temperature and heat sources on PTC objects. These curves are created automatically.
2D/3D results Temperature The transient temperature distribution is a scalar 3D field which is recorded at times previously defined with a 3D Field Monitor. It can be evaluated also on a 2D cut-plane.
Heat Flow Density The stationary heat flow is a 3D vector field, which is recorded at times previously defined with a 3D Field Monitor. This field type shows were heat is transferred inside a structure, it can be evaluated also on a 2D cut-plane.
See also Thermal Transient Solver, Monitor at Point, 3D Field Monitor, Post Processing Overview, Template Based Post Processing
HFSS视频教程 ADS视频教程 CST视频教程 Ansoft Designer 中文教程 |
|
Copyright © 2006 - 2013 微波EDA网, All Rights Reserved 业务联系:mweda@163.com |
|