Wizard / Compare multiple runs
Macros Macros Macros Wizard Wizard Compare multiple runs Compare multiple runs
This wizard enables you to compare all kinds of 1D Result data from
different simulations with little user interaction.
The user is mainly involved in three tasks:
1) Selection of projects for comparison
2) Selection of result types for comparison
3) Comparison of the selected results
If you have stored data in the result cache,
this macro is a very comfortable way to compare all the data (Result
Data Cache Overview).
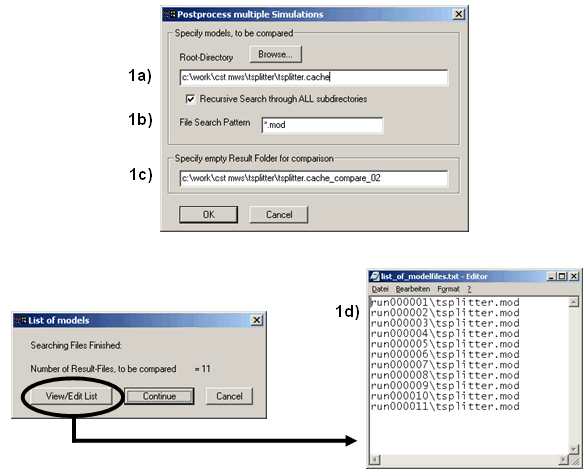
1) Selection of projects for comparison
To select the projects to be compared the user
has to
1a) define a root directory in your windows
system 鈥?if it exists, the result cache directory would be the default
鈥?and
1b) define an additional file template (e.g.
coaxial*.mod) and
1c) specify an empty folder for the result documents
of the comparison 鈥?the comparison folder 鈥?and
1d) in case not all or too many projects are
selected for the comparison, edit the project list manually.
Please note: All project names are addressed relative
to the root directory.
2) Selection of result types for comparison
A large part of the 1D result data is compared
automatically. This includes
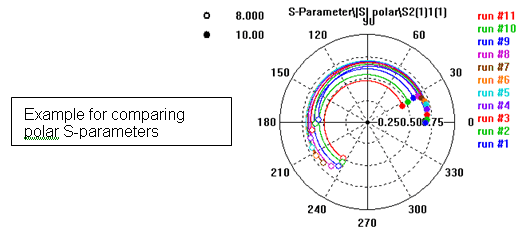
鈥?all S-parameters (linear, dB, phase and polar),
鈥?all existing AR-filter results,
鈥?all time signals (both incoming and outgoing),
鈥?all balance and energy curves,
鈥?all probes and voltages (as time signals as
well as frequency information) and
鈥?all 1D- and 0D-Results, defined via the Postprocessing
templates (for detailed information read chapter 7)
鈥?all impedances, currents and voltages (for
lumped elements and discrete ports).
In most cases, this default comparison is probably
sufficient to extract the desired information.
However, within an extra dialog you may select
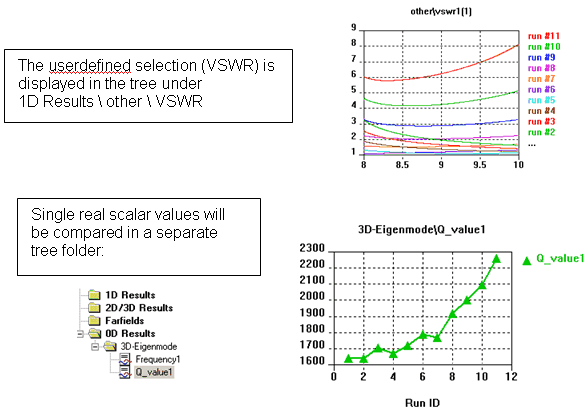
additional data that is used for the comparison. This data can be either
a single real scalar value per simulation or a sequence of scalar values
(1D curve, e.g. VSWR) per simulation.
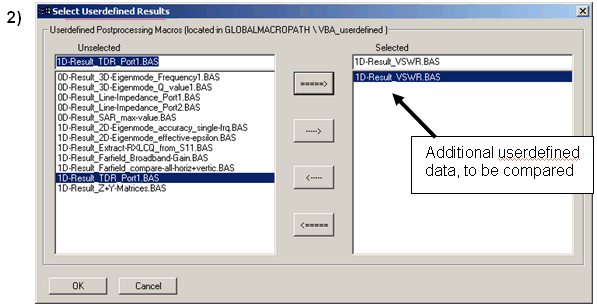
Once you have finished selecting the result
types for the comparison by confirming with Ok, CST MWS will automatically
collect all the results from the different projects and store them in
a central document, located in the comparison folder. Depending on the
number of projects and on the file sizes of the respective results, the
collection can take a few minutes.
3) Comparison of the selected results
Finally, you obtain two different documents,
containing the selected data:
3a) An Excel sheet, showing the run IDs, the
corresponding parameter values and original project file name.
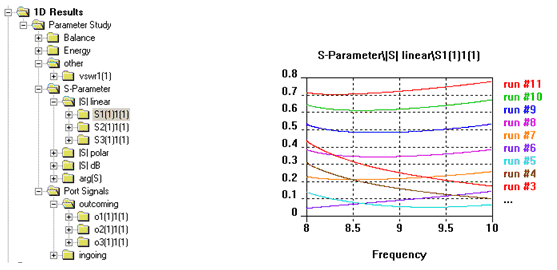
3b) A new project file containing all the result
data but not containing any geometry.
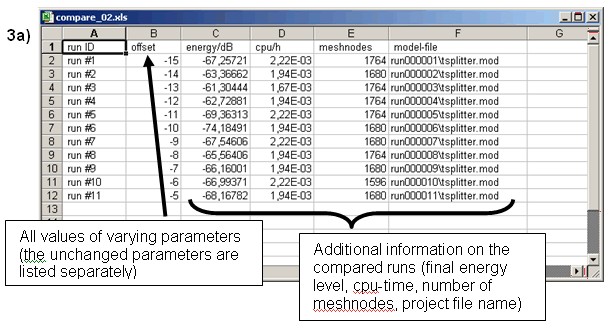
Whereas the Excel sheet serves as a reference
to connect parameter values to run-ID numbers, all comparison plots are
performed within the newly generated MWS project:
Implementing your own Result routines
As you have seen in the previous example, a
number of examples for additional userdefined postprocessing already exists.
All these files are located in a central directory within your installation
(GLOBAL_Library_PATH \ Macros \ MWS \ VBA_userdefined), so that you can
also access them manually or add your own examples.
In case you wish to add your own examples, please
keep in mind the following guidelines:
1. Single real scalar
values
鈥?The filename has
to have the pattern 鈥?D-Result_*.BAS鈥?/p>
鈥?The internal variable
sMacrobase has to be set to that filename.
鈥?The single scalar
value should be assigned to the variable cst_value.
2. 1D-Results
鈥?The filename has
to have the pattern 鈥?D-Result_*.BAS鈥?/p>
鈥?The 1D result curve(s)
should be stored in a two column ASCII file(s), named GetProjectBaseName+"^*.sig",
so that they are automatically compared.
鈥?Please do not change
the header, nor the end of the macro which controls the error handling.
You can manually access such a bas-file by loading
it into the VBA-editor ( in IDE) and executing it ( in IDE) and executing it ( ) )
If you wish to automate the access to one of
those single scalar value or 1D curve results, you can use the following
syntax:
'#include "mws_evaluate-results.lib"
Sub Main
鈥檙; example 0D-Result
Dim q1 As Double
q1=Evaluate0D("0D-Result_3D-Eigenmode_Q_value1.BAS")
MsgBox CStr(q1)
鈥檙; example 1D-Result
Evaluate1D("1D-Result_VSWR.BAS")
End Sub
Cancel
Closes this dialog box without performing any
further action.
Help
Shows this help text.
See also
Preloaded
Macros Overview, Result
Data Cache Overview




HFSS视频教程
ADS视频教程
CST视频教程
Ansoft Designer 中文教程
|