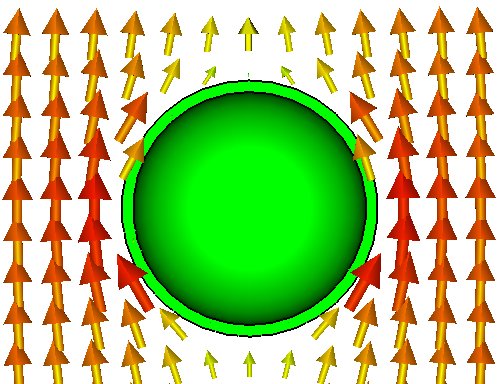


This example represents the TEAM 11 workshop problem and shows the calculation of a conducting hollow sphere in a uniform transiently varying magnetic field created by a magnetic coil. The detailed description of the problem geometry as well as the analytical solution can be found in C.R.I. Emson "Summary of Results for Hollow Conducting Sphere in Uniform Transiently Varying Magnetic Field (Problem 11)", COMPEL, vol. 9(3), pp. 191-203, 1990.
The hollow conducting sphere is generated by a sphere made of conducting material from which another sphere made of vacuum is subtracted. To prescribe a transiently varying character to the coil current, an excitation signal in form of a step function is defined: at time t=0 s the field, initially zero, is switched to 1 Tesla.
All model dimensions are introduced parametrically. Magnetic boundary conditions are applied and three symmetry planes are defined in order to simulate only a one eighth of the structure.
To obtain highly accurate simulation results, two dummy solids with vacuum material properties are added inside and around the conducting sphere ("ball_inside" and "solid1", respectively). A small local mesh size has been set for all three solids. This ensures a fine mesh in the neighborhood of the sphere while allowing a coarse mesh away from the structure.
Two 3D field monitors (magnetic flux density and eddy current density), monitor at point (the z-component of the magnetic flux density at the origin) and three monitors on solids (energy/losses in the conducting sphere, voltage of the coil) are defined. These quantities can be then compared to the analytical solution given in the referenced paper.
Before starting a solver, a transient variation described by a newly defined step function signal has to be linked to the current coil. The desired accuracy of the linear solver is equal to 1e-004. The structure is simulated in the duration of 20ms using the adaptive time stepping regime with a relative error tolerance equal to 1e-003.
After the solver run, the simulation results for the defined monitors can be found in the navigation tree in 1D Results and 2D/3D Results folders. Additionally, one can make use of the geometrical curves and carry out Template Based Postprocessing operations employing the monitored 3D-field results. It can be observed that the simulated data are in good agreement with the reference values.