Evaluate Field on Curve
 2D/3D Plot: Evaluate Fields 2D/3D Plot: Evaluate Fields  Evaluate Field on Curve Evaluate Field on Curve
This dialog box offers the possibility to evaluate
previously monitored fields along a specified curve. The field values
can be analyzed as a 1D result added to the navigation
tree or online by moving a special marker along the curve. The
correspondent information is then displayed in the upper left corner of
the main plot window.
To enter the dialog you first have to select a field
plot in the folder 2D/3D
Results. In case that you want to change the analyzed field the
dialog has to be reopened. Besides you also need to define a curve containing
only one path on which the field evaluation is performed.
Simple path curves
Select here the curve on which
the field should be evaluated. Note that only curves containing one path
are listed in this box.
Option frame
Component:
Select here the field component you want to analyze. This choice does
not affect the visualized field in the main plot window.
Tangential: The field component tangential to the curve
path.
X, Y, Z, Abs: The x-, y- or z-component
or the absolute value of the field.
Hide
fields: Hides or unhides the fields in the main view.
Fit
curve to grid for plotting: Activate this check button to see the
grid representation of the curve. In this case the evaluation for the
marker and the 1D plot is performed along the corresponding grid lines.
Fit
curve to grid for integration: Activate this check button to use the
grid representation of the curve for the field integration.
Marker frame
A special marker visualized
by a red arrow indicates the current position on the selected curve. Move
this marker along the curve by use of the arrow keys (left/right or up/down)
or with help of the Position input field.
Pos.: Change here the current position of the marker on the selected
curve.
Output: Select here the evaluation output, choosing between real and
imaginary part (Re/Im) or amplitude and phase (Am/Ph) representation.
Show
marker coordinates: If this button is checked
the global maker coordinates are additionally displayed in the main window.
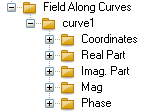
Make 1D Plot
|
Press
this button to save the evaluation result of the currently chosen field
component as a 1D result curve in the 1D
Result folder.
This is performed for the real and imaginary part as well as for the amplitude
and phase. |
|
Close
Closes this dialog box without performing
any further action.
Help
Shows this help text.
Main View Info
In the upper left corner of
the main view some information about the selected curve, the chosen field
settings and finally the evaluation results are displayed.
Curve name:
The name of the currently selected curve.
Curve length:
The length of the currently selected curve in global coordinates.
Component: The field component chosen in the Component drop down
list.
Integral
Re/Im: Real and imaginary part of the integrated
field component along the total curve path.
Marker
position: The position of the marker on the selected curve referred
to the given curve length.
Pos.
(X,Y,Z): The position of the marker in global
coordinates. Displayed only if the Show marker coordinates button
is checked.
Tan.
(X,Y,Z): The direction vector of the marker
tangential to the current curve. Displayed only if the Show marker
coordinates button is checked.
Marker
field Re/Im: Real and imaginary part of the evaluated field component
on the selected curve at the current position of the marker.
See also
1D Result View,
2D/3D
Results, Curve
Creation, Evaluate
Field on Face


HFSS视频教程
ADS视频教程
CST视频教程
Ansoft Designer 中文教程
|