|
微波射频仿真设计 |
|
|
微波射频仿真设计 |
|
| 首页 >> Ansoft Designer >> Ansoft Designer在线帮助文档 |
|
Generating Reports and Postprocessing > Apply Receiver Jitter and Noise Controls SimultaneouslyYou can apply distributions of receiver jitter (variation in timing) and noise (variation in voltage) to the simulated data, using the controls in the Distribution section of the reporter dialog.  • Select the checkbox of the primary distribution. Use the pulldown to select Receiver Jitter, Receiver Noise, or User Defined. Enter data by clicking the Edit button. • To specify a secondary distribution, click the second checkbox and specify the data for that distribution. • The primary selection defaults to Receiver Jitter; the secondary selection defaults to Receiver Noise. (The secondary distribution is enabled only if the primary is checked). For Receiver Jitter, the Edit button opens the Receiver Jitter Distribution dialog:
• The DLL Std Dev and DLL Taps fields specify a timing offset due to variations in a tapped delay line interpolator. The DLL Std Dev field is the standard deviation of the offset in units of time. The DLL Taps field is the number of taps (which must be an even number). • The Static Offset field specifies a time offset to apply to the jitter probability density function. • Add one or more Gaussian distributions, giving the standard deviation in time, and the mean of the distribution if non-zero. • Add one or more Uniform distributions, giving the width of the distribution in time, and the center of the distribution if non-zero. • Use the Add Row and Delete Row buttons to manage multiple distributions. For Receiver Noise, the Edit button opens the Receiver Noise Distribution dialog:
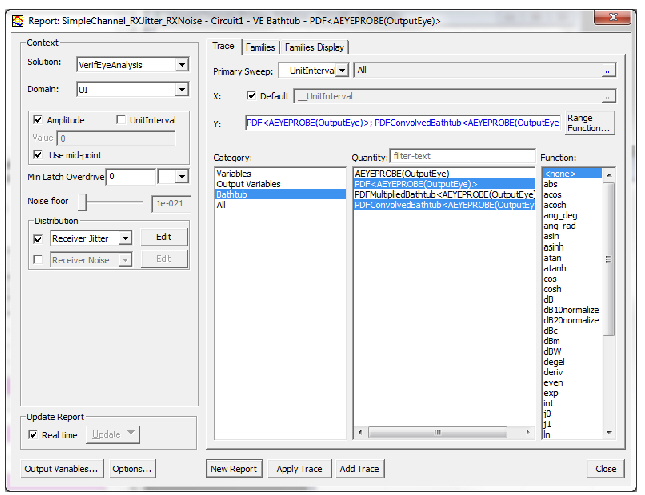
• Add one or more Gaussian distributions, giving the standard deviation in time, and the mean of the distribution if non-zero. • Add one or more Uniform distributions, giving the width of the distribution in time, and the center of the distribution if non-zero. • Use the Add Row and Delete Row buttons to manage multiple distributions. To view the added jitter or noise, a VerifEye bathtub plot is commonly used. Select the EYEPROBE trace, the PDF trace and the PDFConvolvedBathtub trace for plotting.
The Bathtub plot shows the results:
The AEYEPROBE trace shows the BER curve before the jitter is applied. The PDF trace shows the jitter probability density function, a Gaussian distribution with a standard deviation of 3ps in a UI of 1ns. The PDFConvolvedBathtub trace shows the narrowing of the BER bathtub due to the jitter.
HFSS视频教程 ADS视频教程 CST视频教程 Ansoft Designer 中文教程 |
|
Copyright © 2006 - 2013 微波EDA网, All Rights Reserved 业务联系:mweda@163.com |
|