|
微波射频仿真设计 |
|
|
微波射频仿真设计 |
|
| 首页 >> Ansoft Designer >> Ansoft Designer在线帮助文档 |
|
Nexxim Simulator > Voltage-Controlled Current Source, Piecewise Linear
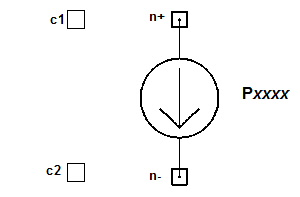 Piecewise Linear VCCS Netlist FormatThe P element is a piecewise linear dependent voltage-controlled current source generated for Nexxim by Ansoft Maxwell Spicelink. The netlist format for the P element is: Pxxxx n+ n- ISRC V(c1) [V(c2)] modelname n+ is the positive node and n- is the negative node of the current source. ISRC is required for the P element type. c1 and (optionally) c2 are the nodes whose voltages control the P current source. modelname is the name of a .MODEL statement of type PWL elsewhere in the netlist. Piecewise Linear VCCS Netlist ExamplePgclamp 6 3 ISRC V(7) pwrclamp Ppullup 6 2 ISRC (V13) V(8) pulldown Notes1. The PWL model allows a single dependent data set, which can be controlled by one or two independent data sets. The model for a P-element PWL dependent source with one independent variable and one dependent variable has the following netlist syntax: .MODEL modelname PWL TABLE=( + data_block + ) [extrapolation1] [extrapolation2] ... The syntax for a one-independent variable , one-dependent variable block (data_block) is: + count, + i1, ... , + icount, + 1 + d2, ... dcount 2. The syntax for a PWL model with two independent variables and one dependent variable has the following netlist syntax: .MODEL modelname PWL TABLE=( + count1 + i11, ... i1count1, + 0, + data_block1 ... + data_blockcount1 + ) [extrapolation1] [extrapolation2] ... The modelname is the name used by the P-elements that refer to this model. The keyword PWL is required. 3. The TABLE data describes families of curves, that allow the simulator to interpolate over one controlling variable at a time. The basic syntax block (data_block) consists of one independent variable and one dependent variable. The independent variable data is introduced by the number of data points for that variable (count), followed by the data points (i11, ... i1count1). The independent variable data set is followed by the set of dependent variable data, introduced by a 1 (representing the number of dependent variables), then the dependent data points (d2, ... dcount). See Example 1 below. 4. If there are two independent variables, the outer variable is specified first, starting with the number of data points for that variable (count1), then the data points (i11, ... i1count1). The second or inner independent variable points and all the dependent data is introduced by a zero (0), then by count1 independent-dependent blocks of data, one block for each point in (i11, ... i1count1). See Example 2 below. 5. The table data can be followed by the extrapolation specifications, one for each set of independent data. Each extrapolation specifies the type of extrapolation to use: linear, constant, or periodic. Linear is the default. PWL Dependent Source Model ExamplesExample 1 The first example models a source with one independent variable i1 and one dependent variable d1 with the ten data points listed in the table below:
The .MODEL statement for example 1 would be: .MODEL pwrclamp PWL TABLE=( Example 2 The second example models a source with two independent variables i1 and i2, and one dependent variable d1 with the 13 data points listed in the table below:i
The .MODEL statement for example 2 would be: .MODEL pulldown PWL TABLE=( + 2, 0.0 1.0, $ First independent variable + 0, $ Start of nested data + 3, 0.0, 1.0, 2.0 $ First inner block + 1, $ Start of dependent variable data for first block + 0.0, 0.0, 0.0 + 10, $ Second inner block + -0.5, -0.4, -0.3, -0.2, -0.1, + 0.0, 0.1, 0.2, 0.3, 0.4, + 1 $ Start of dependent variable data for second block + -0.04979, -0.04152, -0.03233, -0.02176, -0.01096, + 4.85e-9, 0.01082, 0.02121, 0.03117, 0.04072 + ) CONSTANT LINEAR
HFSS视频教程 ADS视频教程 CST视频教程 Ansoft Designer 中文教程 |
|
Copyright © 2006 - 2013 微波EDA网, All Rights Reserved 业务联系:mweda@163.com |
|


