|
微波射频仿真设计 |
|
|
微波射频仿真设计 |
|
| 首页 >> Ansoft Designer >> Ansoft Designer在线帮助文档 |
|
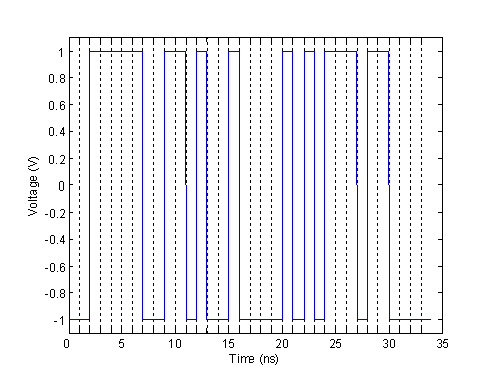
Nexxim Simulator > Eye DiagramsEye diagrams are useful tools to help answer one of the fundamental questions of signal integrity: if we transmit a sequence of ones and zeros into a channel, separated in time by a specified unit interval (UI) what are the chances of correctly detecting the sequence of bits at the far end? In a traditional eye diagram, copies of the waveform generated at the far end of the channel by transient analysis are overlaid at a spacing of one unit interval (UI). For certain types of channels, the resultant diagram resembles an eye, hence the name. The required width of the eye depends on the bit error rate (BER) due to timing variations such as jitter and variations in setup and hold times. The required height of the eye depends on the noise margin. Slicing through the eye at the midpoint of the amplitude displays the BER as a “bathtub” curve. In high-speed channels, the required BER becomes very small, and generating a useful eye diagram or bathtub curve requires long simulation runs. Here is a simple example. Suppose the channel we want to analyze is a 100-ohm differential driver feeding into an R-C load with R=100 ohms and C=40 pF. Figure 1 shows the input bit sequence to the channel:
Figure 1: Input to Simple R-C channel. 1V represents a logic “1”, while -1V represents a logic “0”. The unit interval (UI) is 1ns.
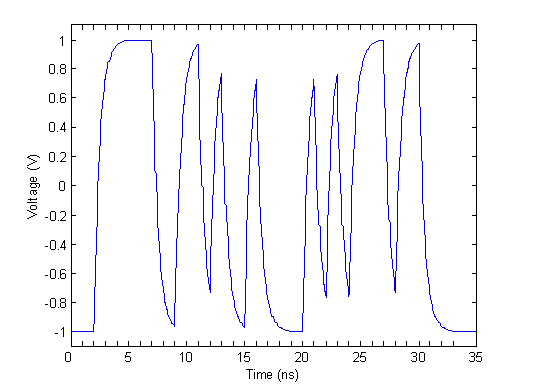
Figure 2: The response of the simple R-C channel.
Figure 2 shows the measured response at the receiver end of the channel, showing the degradation of the original stream of bits as it goes through the channel. Fundamentally, the purpose of an eye diagram is to indicate the allowable window for distinguishing bits from each other at the receiver end. The width and height of the eye opening are the dimensions of the window. There is a non-zero eye width required, because receive jitter makes the time location of the bit imprecise, and setup and hold times also increase the width of the window. The required height of the window is given by the noise margin of the receivers. Given the window, the question is, how often does the waveform violate this window? This is the Bit-Error Rate, or BER.
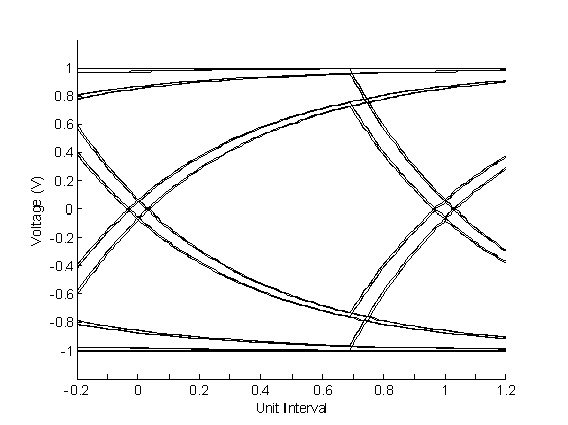
Figure
3: The eye diagram created by shifting and overlaying the waveform of
Figure 2.
Comparison of Figure 2 with Figure 3 shows the principal cause of bit errors, intersymbol interference (ISI). When the response of the channel to a transition takes more than a UI to settle, the effects of previous bits affect the waveform for the current bit. For our example channel, it is clear that the waveform for an isolated “one” surrounded by zeros never gets close to the nominal +1V value. Traditionally, eye diagrams have been measured in the lab, or simulated, in the way described above: the waveform has been overlaid with multiple shifted copies of itself. However, with increasing speeds, particularly in the case of high-speed serial links, the required BER has decreased significantly. This decrease, in turn, has led to a great increase in the number of bits that are needed to be simulated in order to predict the BER. Such lengthy transient simulations are impractical. In practice, designers are interested only in the probability that a waveform will violate the eye window. For this purpose, faster statistical techniques can be used instead of the full transient simulation. Nexxim’s QuickEye analysis uses simplifying assumptions to calculate the probability of a given BER from a transient analysis of single transitions. Nexxim’s VerifEye analysis uses a fully statistical approach to calculate the probability of a given BER. A fundamental assumption of both QuickEye and VerifEye is that we can treat the drivers and channel as a linear time-invariant (LTI) system characterized by its step response. QuickEye and VerifEye are based on the principle of superposition, which makes use of this assumption. Forcing an LTI approximation allows a convolution-based approach to solving the time domain problem. An important feature of both QuickEye and VerifEye is the ability to simulate the effects of equalization on the channel. Both analyses can add feed-forward and decision-feedback equalization (FFE and DFE).
HFSS视频教程 ADS视频教程 CST视频教程 Ansoft Designer 中文教程 |
|
Copyright © 2006 - 2013 微波EDA网, All Rights Reserved 业务联系:mweda@163.com |
|