|
微波射频仿真设计 |
|
|
微波射频仿真设计 |
|
| 首页 >> Ansoft Designer >> Ansoft Designer在线帮助文档 |
|
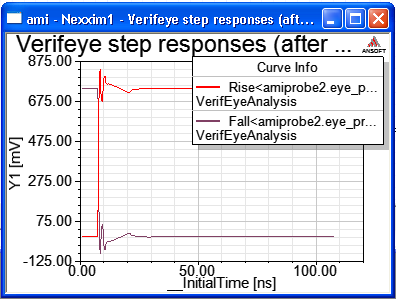
Nexxim Simulator > Analyzing AMI Models with VerifEyeInstead of using the AMI_GetWave() data to create a time-domain waveform, you can use VerifEye to generate the impulse response from the channel parameters and applying the modifications in the AMI_Init() functions from both transmitter and receiver. When used with AMI, VerifEye uses only the AMI_Init() functions. The AMI_Getwave() function is ignored. VerifEye is more accurate than standard AMI analysis, but computes only the linear part of the model’s behavior. VerifEye analysis assumes that incoming 0 and 1 bits are independent and occur with equal probability 0.5. The VerifEye setup and run is the same as for standard VerifEye analysis. See VerifEye and QuickEye Analyses for details. Three kinds of VerifEye reports are available: step response, contour plot, and bathtub curve. Here is an example of a step response report:
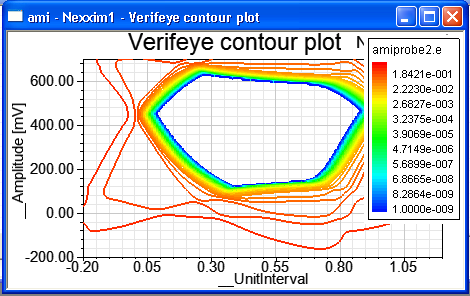
In AMI analysis, you can see the initial and final impulse responses. With VerifEye you can see only the final step response (after the AMI_Init() functions have been applied). Here is an example of a contour plot:
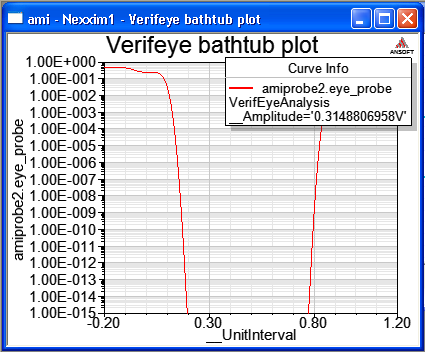
The VerifEye contour plot is always centered around 0.5 of the UI, while AMI’s transient eye takes into account the actual phase shift of the signal. Here is an example of a bathtub plot:
HFSS视频教程 ADS视频教程 CST视频教程 Ansoft Designer 中文教程 |
|
Copyright © 2006 - 2013 微波EDA网, All Rights Reserved 业务联系:mweda@163.com |
|