|
微波射频仿真设计 |
|
|
微波射频仿真设计 |
|
| 首页 >> Ansoft Designer >> Ansoft Designer在线帮助文档 |
|
Network Data Explorer > Viewing Matrix Cell Data Across All Frequencies1. Select Parameter values in the Quantity control field. 2. Select Matrix entries in the data selection pane at left. 3. Select Table in the data view pane at right. 4. Choose the frequency and variation to display.
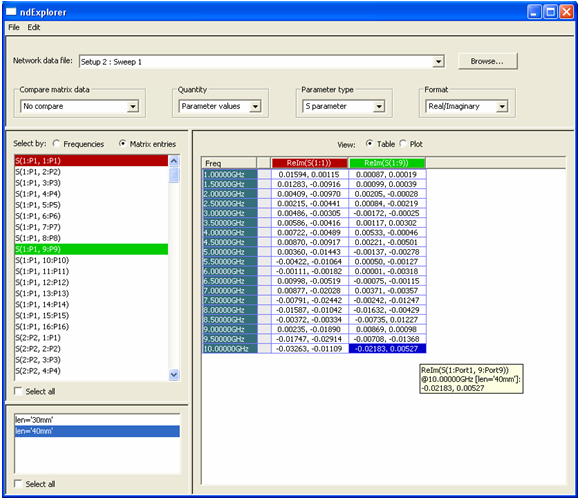
• Values for all frequencies are displayed for each matrix cell selected. The data type and format are determined by the Parameter type and the Format settings in the control pane. • When the cursor is placed over a table cell, tool-tip text reveals more detail as to the content of the cell. Clicking in a cell will select it. Double clicking a cell takes the user to the matrix table view in which all cell values for the corresponding frequency are displayed; the double-clicked cell is highlighted with solid red shading. • Clicking on a column header in the data table highlights the column. The corresponding trace in the plot view is also highlighted. • Selecting Plot in the data view pane, switches the view to a graph of the cell data. The graph shares the same color coding as the columns; highlighted columns are highlighted in the plot.
HFSS视频教程 ADS视频教程 CST视频教程 Ansoft Designer 中文教程 |
|
Copyright © 2006 - 2013 微波EDA网, All Rights Reserved 业务联系:mweda@163.com |
|


