|
微波射频仿真设计 |
|
|
微波射频仿真设计 |
|
| 首页 >> Ansoft Designer >> Ansoft Designer在线帮助文档 |
|
Network Data Explorer > NdExplorer OverviewTo open the NdExplorer, click Tools > Network Data Explorer. The NdExplorer window is divided into the following panes: • Control Pane across the top • Data View Pane to the right • Data Selection Panes to the left — divided into Frequency Selection and Variation Selection
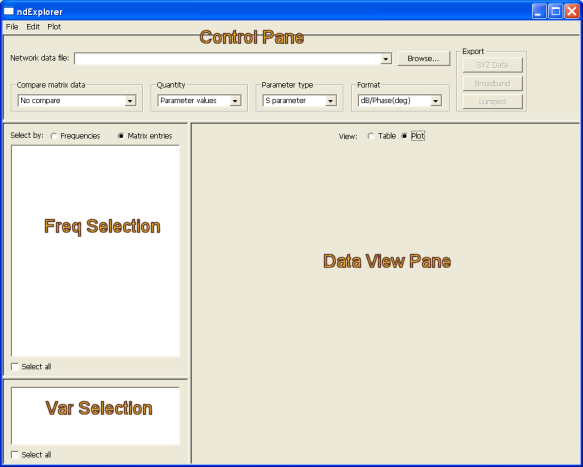
Control Pane The control pane is used to select the network data to be viewed as well as the manner in which it is to be displayed. • Network data file: Name of the currently active data set. • Browse: Clear the current data sets and browse for a new file to load. • Export: Quick buttons for export; same options as those accesed via the File menu. • Compare matrix data: Lets you choose a comparison data set (or none at all). • Quantity: The quantity to display (parameter or statistical). • Parameter type: S, Y, or Z parameters. • Format: The display function to apply to the data: magnitude/phase, real/imaginary, dB/phase, magnitude, phase, dB, real, or imaginary.
Data View Pane The data view pane supports both a tabular view of the matrix data and graphical representations.
Data Selection Pane The data selection pane allows you to choose to display data by frequency or by matrix cell, and to choose which frequencies or cells to display. • The variation list box allows you to control which variations are currently active; this affects all displays (table, plot, and statistics). When displayed by frequency, the entire matrix is presented in the data view pane for each selected frequency; when by matrix cell, the data for the individually chosen cells is shown across all frequencies. • Frequencies unavailable for a variation are dimmed and are not highlighted when selected. • Checking Select all causes all items within the list box to be selected; the corresponding data is displayed in the data view pane. Warning: given the volume of data in many network data sets, this display may take a considerable time to generate, especially when the graph plot view is enabled.
HFSS视频教程 ADS视频教程 CST视频教程 Ansoft Designer 中文教程 |
|
Copyright © 2006 - 2013 微波EDA网, All Rights Reserved 业务联系:mweda@163.com |
|


