|
微波射频仿真设计 |
|
|
微波射频仿真设计 |
|
| 首页 >> Ansoft Designer >> Ansoft Designer在线帮助文档 |
|
Network Data Explorer > Displaying Plot Traces from Multiple Data Sources1. Open multiple data sets, either through the main file browser or through the data comparison browser. 2. Use the Edit menu or the right-click menu to open the Select Compare Variations dialog. 3. Enable the Display plot traces for all data sources option.
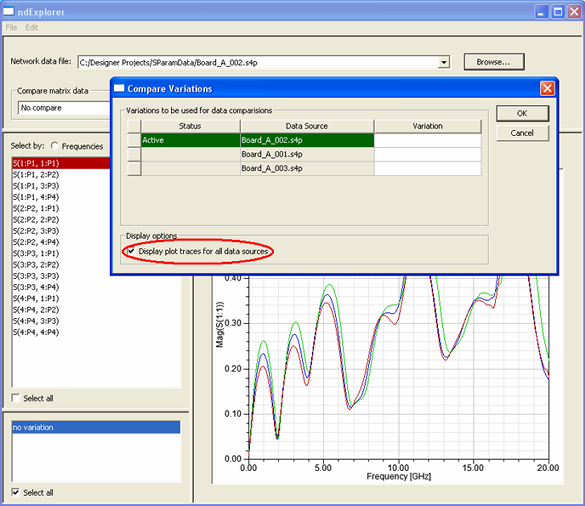
• Traces for a given cell or statistical measure are displayed for all data sets; you can use tool tips to distinguish between them. • If a single cell or statistical measure is displayed, different colors are used for each data trace. • If multiple cells or statistical measures are selected, a single color is used for all data traces for each cell or statistical measure. • If a data comparison is active, traces will be shown for all data sets compared against it (with the exception of the comparison data set). This is true for both cell and statistical traces. • Data sets with no variation information are always displayed. With multiple variation data sets, only those with values for the currently selected variations are displayed. (Note that the variation for the comparison data set is fixed by the selection that is made in the Select Compare Variations dialog.)
HFSS视频教程 ADS视频教程 CST视频教程 Ansoft Designer 中文教程 |
|
Copyright © 2006 - 2013 微波EDA网, All Rights Reserved 业务联系:mweda@163.com |
|


