|
微波射频仿真设计 |
|
|
微波射频仿真设计 |
|
| 首页 >> Ansoft Designer >> Ansoft Designer在线帮助文档 |
|
Network Data Explorer > Creating a Statistics Plot1. Select Matrix statistics in the Quantity control field. 2. Select Matrix entries in the data selection pane at left. 3. Select Plot in the data view pane at right. 4. Choose the statistics and variations to display.
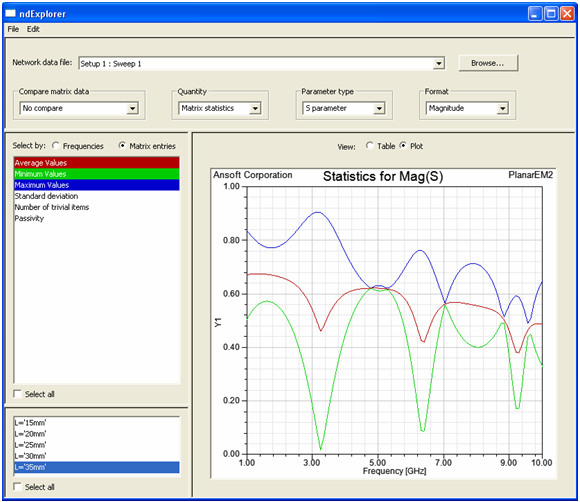
• A graph of each of the statistical measures selected (for the current Parameter type and Format) is displayed across all frequencies. Passivity is only available for S-parameters (comparisons inactive). NTI refers to the number of trivial items; for S-parameters, this includes all zeros and ones; for all other data (and data comparisons), only zeros are counted as trivial. • When the cursor is placed over a curve, tool-tip text indicates the statistical function, the data format, the data type, and the variation of the graph being displayed. • Selecting Table in the data view pane, switches the view to a tabular presentation of the statistical data. The table columns share the same color coding as the plot traces.
HFSS视频教程 ADS视频教程 CST视频教程 Ansoft Designer 中文教程 |
|
Copyright © 2006 - 2013 微波EDA网, All Rights Reserved 业务联系:mweda@163.com |
|


