|
微波射频仿真设计 |
|
|
微波射频仿真设计 |
|
| 首页 >> Ansoft Designer >> Ansoft Designer在线帮助文档 |
|
Network Data Explorer > Color Coded Matrix Plot1. Select Parameter values in the Quantity control field. 2. Select Frequencies in the data selection pane at left. 3. Select Plot in the data view pane at right. 4. Choose the frequency and variation to display.
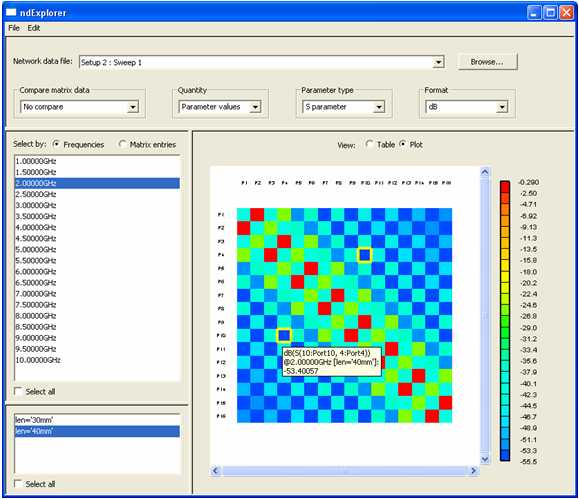
• The matrix values are displayed in a color coded grid; if the current Format is a complex value, only the real component is used to determine the display color. Use the Parameter type selection in the control panel to choose the data type: S, Y, or Z parameter. When multiple frequencies or variations are selected, either the minimum, maximum, or average value is displayed (as chosen with the right-click menu option, Multiple Frequency Statistics). • The maximum value (and its transpose) is highlighted in red and the minimum value in blue; the real value alone is used to determine these extremes. • When the cursor is placed over a cell, tool-tip text reveals detail as to the content of the cell. Clicking in a cell will select it and its transpose. Double clicking a cell takes the user to the matrix cell plot in which all frequency values for that matrix cell are displayed as a graph. • Double clicking the legend or choosing the right-click menu option Color Legend Attributes allows you to select the data range and number of colors for each data type and format. • Selecting Table in the data view pane, switches the view to a matrix representation of the graphical data.
HFSS视频教程 ADS视频教程 CST视频教程 Ansoft Designer 中文教程 |
|
Copyright © 2006 - 2013 微波EDA网, All Rights Reserved 业务联系:mweda@163.com |
|


