|
微波射频仿真设计 |
|
|
微波射频仿真设计 |
|
| 首页 >> Ansoft Designer >> Ansoft Designer在线帮助文档 |
|
Network Data Explorer > Changing the Color Scheme for a Matrix Color PlotDouble clicking the matrix color plot legend or right clicking within the plot itself and choosing Color Legend Attributes, displays the Legend Attributes dialog. The dialog permits you to change the granularity of the color scheme and the value range but not the colors themselves. Using a standard range across all frequencies permits you to quantitatively compare plots; NdExplorer remembers legend settings for each data-type/display-format pair. 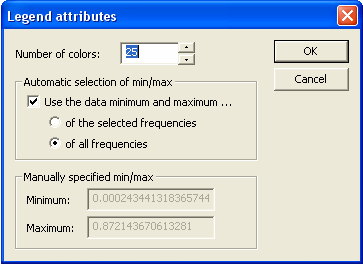
• Number of colors: number of color entries in the legend, i.e. the number of divisions between the start/end of the data range. • Use the data minimum and maximum: automatically select the data range using the minimum and maximum values from either just the selected frequencies or all frequencies in the data set. • Minimum & Maximum: when the range is not automatically determined, these fields permit the user to manually enter hard values, e.g. for S parameter data magnitude data, a mimum of 0 and a maximum or 1 could be used.
HFSS视频教程 ADS视频教程 CST视频教程 Ansoft Designer 中文教程 |
|
Copyright © 2006 - 2013 微波EDA网, All Rights Reserved 业务联系:mweda@163.com |
|


